Tag Archives: game theory

Divine Diversification

There have been some interesting developments in the US insurance sector on the issue of systemically important financial institutions (SIFIs). Metlife announced plans to separate some of their US life retail units to avoid the designation whilst shareholder pressure is mounting on AIG to do the same. These events are symptoms of global regulations designed to address the “too big to fail” issue through higher capital requirements. It is interesting however that these regulations are having an impact in the insurance sector rather than the more impactful issue within the banking sector (this may have to do with the situation where the larger banks will retain their SIFI status unless the splits are significant).

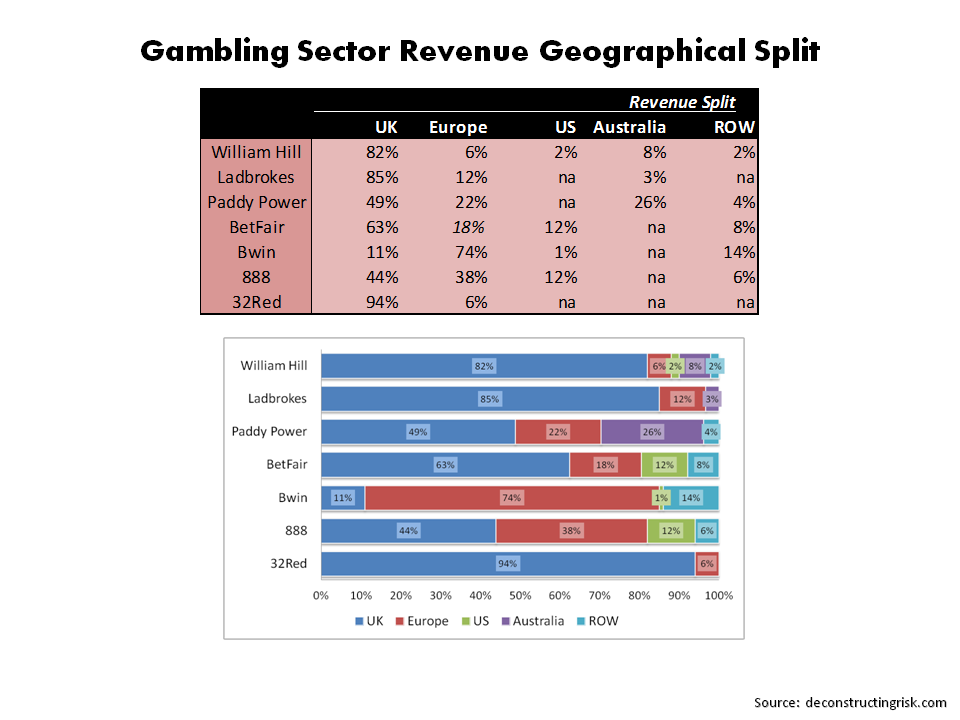
The developments also fly in the face of the risk management argument articulated by the insurance industry that diversification is the answer to the ills of failure. This is the case AIG are arguing to counter calls for a breakup. Indeed, the industry uses the diversification of risk in their defences against the sector being deemed of systemic import, as the exhibit below from a report on systemic risk in insurance from an industry group, the Geneva Association, in 2010 illustrates. Although the point is often laboured by the insurance sector (there still remains important correlations between each of the risk types), the graph does make a valid point.

click to enlargeEconomic Capital Breakdown for European Banks and Insurers

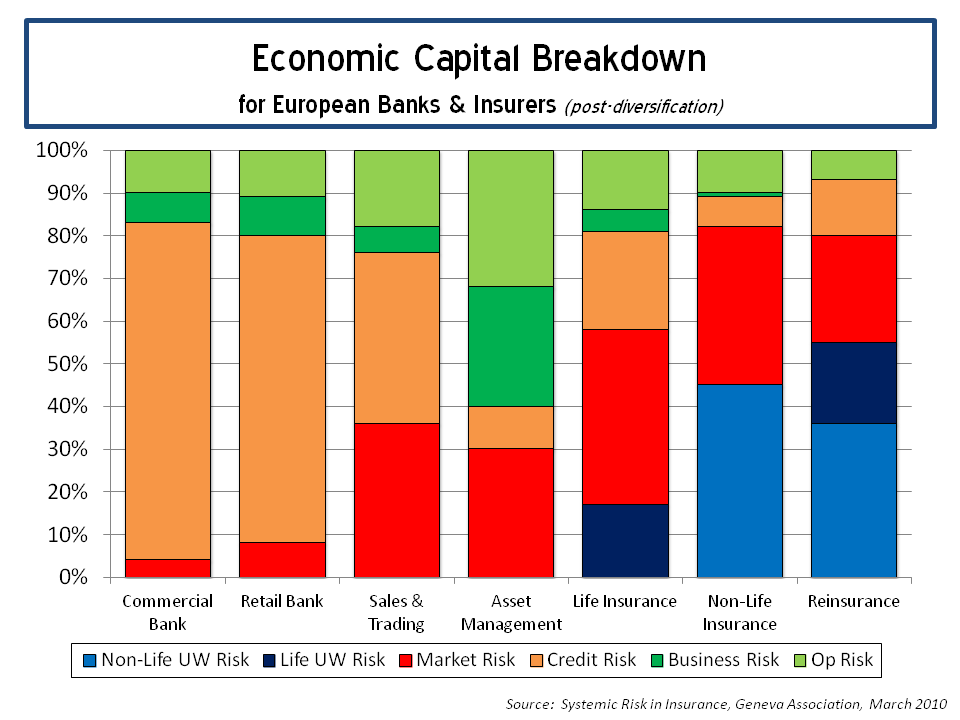
The 1st of January this year marked the introduction of the new Solvency II regulatory regime for insurers in Europe, some 15 years after work begun on the new regime. The new risk based solvency regime allows insurers to use their own internal models to calculate their required capital and to direct their risk management framework. A flurry of internal model approvals by EU regulators were announced in the run-up to the new year, although the amount of approvals was far short of that anticipated in the years running up to January 2016. There will no doubt be some messy teething issues as the new regime is introduced. In a recent post, I highlighted the hoped for increased disclosures from European insurers on their risk profiles which will result from Solvency II. It is interesting that Fitch came out his week and stated that “Solvency II metrics are not comparable between insurers due to their different calculation approaches and will therefore not be a direct driver of ratings” citing issues such as the application of transitional measures and different regulator approaches to internal model approvals.

I have written many times on the dangers of overtly generous diversification benefits (here, here, here, and here are just a few!) and this post continues that theme. A number of the large European insurers have already published details of their internal model calculations in annual reports, investor and analyst presentations. The graphic below shows the results from 3 large insurers and 3 large reinsurers which again illustrate the point on diversification between risk types.

click to enlargeInternal Model Breakdown for European Insurers and Reinsurers

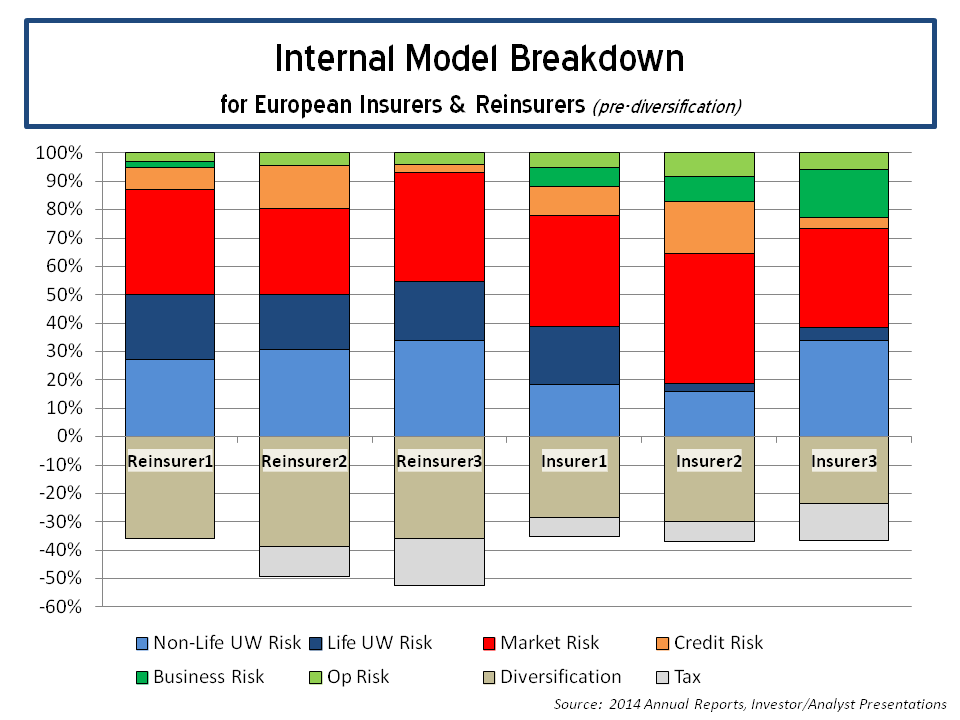
The reinsurers show, as one would expect, the largest diversification benefit between risk types (remember there is also significant diversification benefits assumed within risk types, more on that later) ranging from 35% to 40%. The insurers, depending upon business mix, only show between 20% and 30% diversification across risk types. The impact of tax offsets is also interesting with one reinsurer claiming a further 17% benefit! A caveat on these figures is needed, as Fitch points out; as different firms use differing terminology and methodology (credit risk is a good example of significant differences). I compared the diversification benefits assumed by these firms against what the figure would be using the standard formula correlation matrix and the correlations assuming total independence between the risk types (e.g. square root of the sum of squares), as below.

click to enlargeDiversification Levels within European Insurers and Reinsurers

What can be seen clearly is that many of these firms, using their own internal models, are assuming diversification benefits roughly equal to that between those in the standard formula and those if the risk types were totally independent. I also included the diversification levels if 10% and 25% correlations were added to the correlation matrix in the standard formula. A valid question for these firms by investors is whether they are being overgenerous on their assumed diversification. The closer to total independence they are, the more sceptical I would be!

Assumed diversification within each risk type can also be material. Although I can understand arguments on underwriting risk types given different portfolio mixes, it is hard to understand the levels assumed within market risk, as the graph below on the disclosed figures from two firms show. Its hard for individual firms to argue they have material differing expectations of the interaction between interest rates, spreads, property, FX or equities!

click to enlargeDiversification Levels within Market Risk

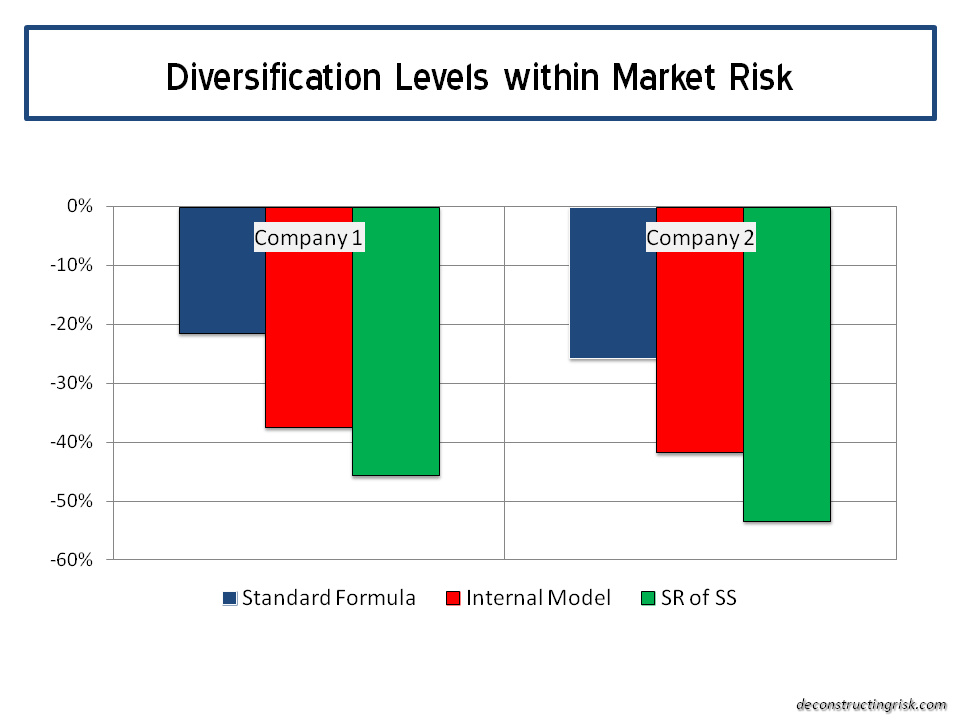
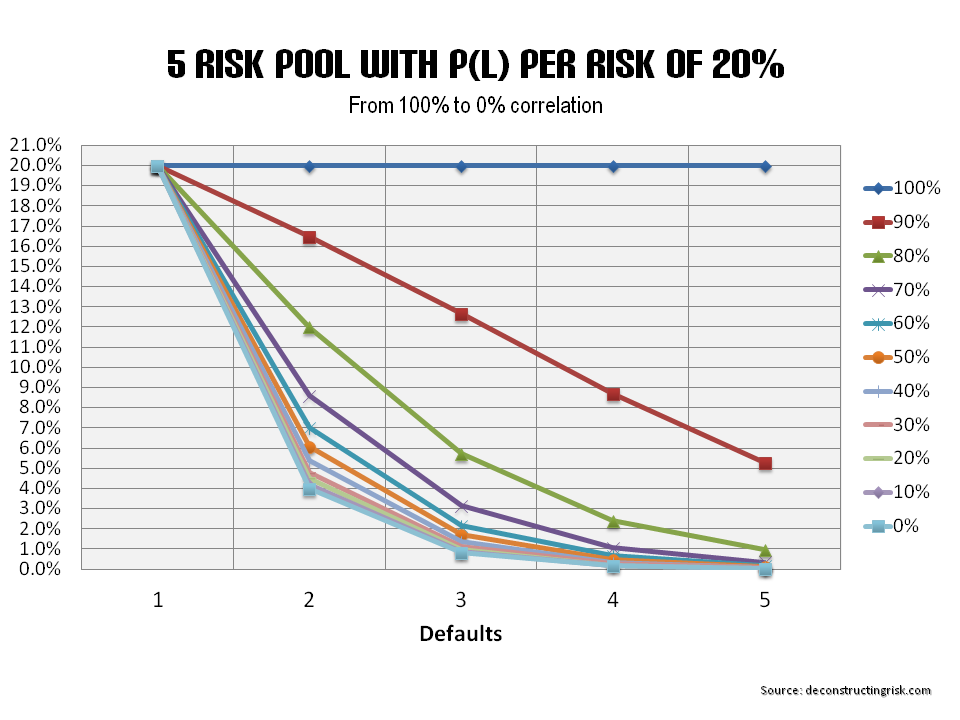
Diversification within the life underwriting risk module can also be significant (e.g. 40% to 50%) particularly where firms write significant mortality and longevity type exposures. Within the non-life underwriting risk module, diversification between the premium, reserving and catastrophe risks also add-up. The correlations in the standard formula on diversification between business classes vary between 25% and 50%.

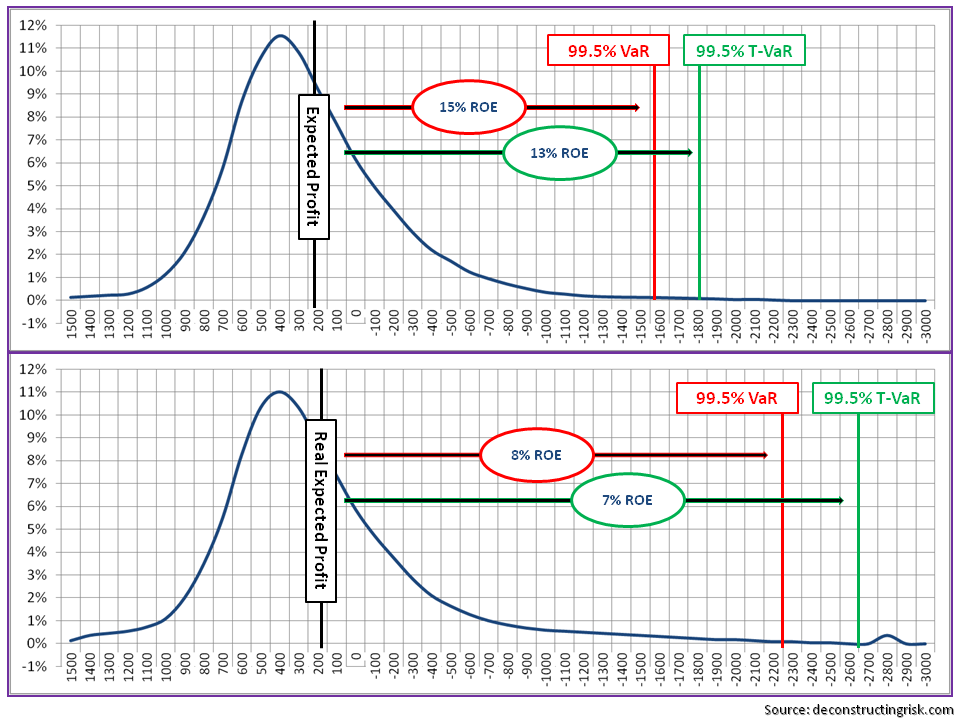
By way of a thought experiment, I constructed a non-life portfolio made up of five business classes (X1 to X5) with varying risk profiles (each class set with a return on equity expectation of between 10% and 12% at a capital level of 1 in 500 or 99.8% confidence level for each), as the graph below shows. Although many aggregate profiles may reflect ROEs of 10% to 12%, in my view, business classes in the current market are likely to have a more skewed profile around that range.

click to enlargeSample Insurance Portfolio Profile

I then aggregated the business classes at varying correlations (simple point correlations in the random variable generator before the imposition of the differing distributions) and added a net expense load of 5% across the portfolio (bringing the expected combined ratio from 90% to 95% for the portfolio). The different resulting portfolio ROEs for the different correlation levels shows the impact of each assumption, as below.

click to enlargePortfolio Risk Profile various correlations

The experiment shows that a reasonably diverse portfolio that can be expected to produce a risk adjusted ROE of between 14% and 12% (again at a 1 in 500 level)with correlations assumed at between 25% and 50% amongst the underlying business classes. If however, the correlations are between 75% and 100% then the same portfolio is only producing risk adjusted ROEs of between 10% and 4%.

As correlations tend to increase dramatically in stress situations, it highlights the dangers of overtly generous diversification assumptions and for me it illustrates the need to be wary of firms that claim divine diversification.

Gambling Problems

It has been about 6 months since I posted on the gambling and gaming sector (also earlier here) and there has been a lot going on. BWIN, after being on the block for some time, is closing in on a sale of its business with 888 and GCV (in conjunction with PokerStars and FullTilt owner Amaya) the speculated favourites. 888 itself rejected an offer from William Hill earlier in February this year. Meanwhile, Betfair and PaddyPower opted to return their cash piles of £200 million and €440 million respectively to shareholders rather than get involved in any M&A.

Ladbrokes, after a series of poor results, promoted the digital head Jim Mullen to CEO who is currently involved in a route and branch review of the firm with the outcome due to announced in June. His first move was to put the Irish business into examinership. Ladbrokes woes have continued with poor gambling Q1 results, continuing a run of bad luck after a disastrous boxing day football gross loss, as the exhibit below shows.

click to enlarge2014 Boxing Day 11 standard deviations

As can be seen by the graph below, Breon Corcoran’s rehabilitation of Betfair’s exchange model has resulted in an outstanding performance with a near doubling of the stock. The ex-Paddy Power executive has delivered on his plans for the betting exchange (as detailed in this post). [Update: Numis just released a note on Betfair’s rich valuation as per this article.] The tiny casino player 32Red has also had a good run due to solid 2014 results and M&A speculation.

click to enlargeShare Price 6months to May 2015 William Hill Ladbrokes Paddy Power Betfair 888 BWIN 32red

Internal candidates in William Hill and Paddy Power, James Henderson and Andy McCue respectively, also took over the CEO role.

The challenges for the sector are considerable. In the UK, the point of consumption (POC) tax of 15% has been in force in the UK since December and a new 25% rate of Machine Games Duty (MGD) applied from the 1st of March. Uncertain regulation across Europe and the lack of traction in opening of US markets are other headwinds.

Operator’s ability to reduce pay-outs to punters to counter tax increases is restricted by the competitive nature of the market, particularly online as the graph below on gross win percentages illustrates.

click to enlargeOnline Sportsbook Gross Win Percentage

Taking the commentary from the operators on the impact of increased taxes, I estimated the likely impact on net margins for a number of firms (as the graph below shows).

click to enlargeNet Margin estimates to 2015 gambling firms

The market is giving Betfair and Paddy Power credit for their recent revenue growth, strong operating results, product development and strong mobile adoption. Based upon my estimates, both trade on a 2015 PE in the low 30’s.

click to enlargeMarket valuations gambling firms

A brief review of the business profile of a selection of firms illustrates the differing models, as per the exhibits below.

click to enlargeGambling Sector Revenue Split & EBITDA estimates

click to enlargeGambling Sector Revenue Geographical Split 2015

It will be fascinating to see how the remainder of 2015 plays out for this sector. Scale is undoubting going to be a strength for firms in the future. What the large UK operators, Ladbrokes and William Hill, will do to counter headwinds will be intriguing. Although there is nothing to suggest it is remotely likely, it occurs to me that a tie-up between Paddy Power and Betfair would make a powerful combination.

Tails of VaR

In an opinion piece in the FT in 2008, Alan Greenspan stated that any risk model is “an abstraction from the full detail of the real world”. He talked about never being able to anticipate discontinuities in financial markets, unknown unknowns if you like. It is therefore depressing to see articles talk about the “VaR shock” that resulted in the Swissie from the decision of the Swiss National Bank (SNB) to lift the cap on its FX rate on the 15th of January (examples here from the Economist and here in the FTAlphaVille). If traders and banks are parameterising their models from periods of unrepresentative low volatility or from periods when artificial central bank caps are in place, then I worry that they are not even adequately considering known unknowns, let alone unknown unknowns. Have we learned nothing?

Of course, anybody with a brain knows (that excludes traders and bankers then!) of the weaknesses in the value-at-risk measure so beloved in modern risk management (see Nassim Taleb and Barry Schachter quotes from the mid 1990s on Quotes page). I tend to agree with David Einhorn when, in 2008, he compared the metric as being like “an airbag that works all the time, except when you have a car accident“.  A piece in the New York Times by Joe Nocera from 2009 is worth a read to remind oneself of the sad topic.

This brings me to the insurance sector. European insurance regulation is moving rapidly towards risk based capital with VaR and T-VaR at its heart. Solvency II calibrates capital at 99.5% VaR whilst the Swiss Solvency Test is at 99% T-VaR (which is approximately equal to 99.5%VaR). The specialty insurance and reinsurance sector is currently going through a frenzy of deals due to pricing and over-capitalisation pressures. The recently announced Partner/AXIS deal follows hot on the heels of XL/Catlin and RenRe/Platinum merger announcements. Indeed, it’s beginning to look like the closing hours of a swinger’s party with a grab for the bowl of keys! Despite the trend being unattractive to investors, it highlights the need to take out capacity and overhead expenses for the sector.

I have posted previously on the impact of reduced pricing on risk profiles, shifting and fattening distributions. The graphic below is the result of an exercise in trying to reflect where I think the market is going for some businesses in the market today. Taking previously published distributions (as per this post), I estimated a “base” profile (I prefer them with profits and losses left to right) of a phantom specialty re/insurer. To illustrate the impact of the current market conditions, I then fattened the tail to account for the dilution of terms and conditions (effectively reducing risk adjusted premia further without having a visible impact on profits in a low loss environment). I also added risks outside of the 99.5%VaR/99%T-VaR regulatory levels whilst increasing the profit profile to reflect an increase in risk appetite to reflect pressures to maintain target profits. This resulted in a decrease in expected profit of approx. 20% and an increase in the 99.5%VaR and 99.5%T-VaR of 45% and 50% respectively. The impact on ROEs (being expected profit divided by capital at 99.5%VaR or T-VaR) shows that a headline 15% can quickly deteriorate to a 7-8% due to loosening of T&Cs and the addition of some tail risk.

click to enlargeTails of VaR

For what it is worth, T-VaR (despite its shortfalls) is my preferred metric over VaR given its relative superior measurement of tail risk and the 99.5%T-VaR is where I would prefer to analyse firms to take account of accumulating downside risks.

The above exercise reflects where I suspect the market is headed through 2015 and into 2016 (more risky profiles, lower operating ROEs). As Solvency II will come in from 2016, introducing the deeply flawed VaR metric at this stage in the market may prove to be inappropriate timing, especially if too much reliance is placed upon VaR models by investors and regulators. The “full detail of the real world” today and in the future is where the focus of such stakeholders should be, with much less emphasis on what the models, calibrated on what came before, say.

Confounding correlation

Nassim Nicholas Taleb, the dark knight or rather the black swan himself, said that “anything that relies on correlation is charlatanism”.  I am currently reading the excellent “The signal and the noise” by Nate Silver. In Chapter 1 of the book he has a nice piece on CDOs as an example of a “catastrophic failure of prediction” where he points to certain CDO AAA tranches which were rated on an assumption of a 0.12% default rate and which eventually resulted in an actual rate of 28%, an error factor of over 200 times!.

Silver cites a simplified CDO example of 5 risks used by his friend Anil Kashyap in the University of Chicago to demonstrate the difference in default rate if the 5 risks are assumed to be totally independent and dependent.  It got me thinking as to how such a simplified example could illustrate the impact of applied correlation assumptions. Correlation between core variables are critical to many financial models and are commonly used in most credit models and will be a core feature in insurance internal models (which under Solvency II will be used to calculate a firms own regulatory solvency requirements).

So I set up a simple model (all of my models are generally so) of 5 risks and looked at the impact of varying correlation from 100% to 0% (i.e. totally dependent to independent) between each risk. The model assumes a 20% probability of default for each risk and the results, based upon 250,000 simulations, are presented in the graph below. What it does show is that even at a high level of correlation (e.g. 90%) the impact is considerable.

click to enlarge5 risk pool with correlations from 100% to 0%

The graph below shows the default probabilities as a percentage of the totally dependent levels (i.e 20% for each of the 5 risks). In effect it shows the level of diversification that will result from varying correlation from 0% to 100%. It underlines how misestimating correlation can confound model results.

click to enlargeDefault probabilities & correlations