Tag Archives: shareholder returns

Level-headed

After a week like the one just gone, where the S&P500 hit the 10% down threshold for the year, it’s perversely healthy to see debates rage about the likelihood of a recession, the future for oil prices, the bursting of the unicorn bubble, the impact of negative interest rates and the fallibility of central bank macro policy in the developed world, to name just a few. Considering and factoring in such risks are exactly what should be happening in a well functioning market, rather than one far too long reliant upon the supposed omnipresent wisdom of central bankers to answer any market ills that may come along. Although the market volatility during the opening months of 2016 hasn’t been pleasant and will hopefully find a floor soon, valuations didn’t reflect risks and an adjustment was needed.

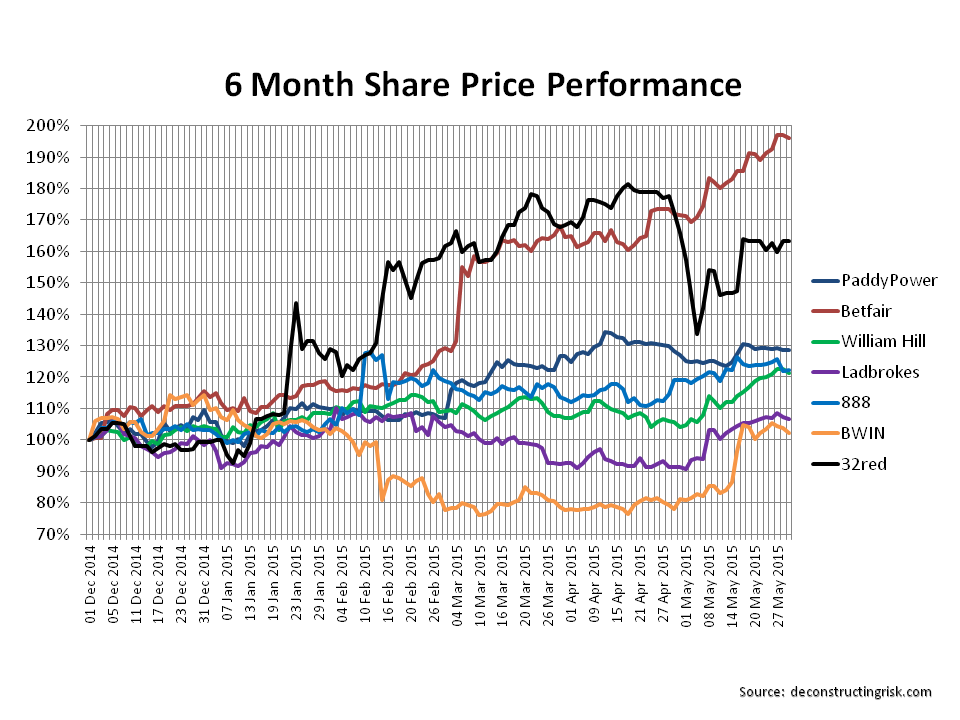
I have no idea where the market is headed, although I suspect we are just one more shake-out from capitulation. Valuations have come off their unsustainable highs and a select few are beginning to look attractive. After some of this week’s indiscriminate falls, it’s always a good risk management discipline to assess current and possible new positions in light of developments. I assessed AAPL’s valuation recently in this post and offered my thoughts on the new Paddy Power Betfair in this post.

The subject of this post is Level 3 (ticker LVLT), a facilities-based provider of a range of integrated telecommunications services. Prior to their earnings on 4th of February, I had been re-examining my investment rationale on LVLT, one of my highest conviction positions that I last posted on a year ago. As I have highlighted before, LVLT is not an investment for the faint hearted and the past week has again proven that (a beta level of 1.5 according to Yahoo just doesn’t capture it!) with daily moves following the Q4 report of +6.9%,-5.7%,-9.4%,+3.7%,+3%, 0.5%, and Friday’s +1.7%. The graphic below shows the movement in the share price in LVLT, the S&P500 and the S&P High Beta index (SPHB) since the start of 2015. Also shown are the daily changes in LVLT against those of the S&P500.

click to enlargeLevel3 SP500 Share Price & Volatility

To recap on the bull case, the strength of LVLT is its deep and global IP optic network which following the recent mergers with Global Crossing and TW Telecom now has the business scale for the experienced management team to finally achieve operating margins to support its debt (current net debt to 2016 guided EBITDA is approx 3.5) and throw off meaningful cash-flow in the coming years (average FCF growth of 8% according to my estimates over the next few years). The Q4 2015 results and 2016 guidance showed the bull case is intact and the demand for new products such as the security and intelligent network services show how LVLT’s network is a competitive advantage in today’s technology driven world. The CEO Jeff Storey summarized their case at the Q4 conference call as follows:

“Most importantly, is our movement towards our vision of one, one set of products that we take to an expanding market, one network to deliver those products globally, one set of operational support systems to enable a differentiated customer experience, and one team with the singular goal of making Level 3 the premier provider of enterprise and networking services. As we look to 2016, our strategy remains the same. We are focused on operational excellence throughout our business, providing a superior experience to our customers and developing the products and capabilities to meet their complex and evolving networking needs.”

As the talk of a possible recession fuelled worries on business telecom spend, I thought it would be useful to look at the historical “as if” results of the now enlarged LVLT through the financial crisis. This involved looking through old Global Crossing and TW Telecom results and making numerous assumptions on the historical growth of acquired businesses and the business classifications (and numerous reclassifications) of each firm over time. The historical “as if” results combined with the reported figures for 2014 to 2015 and analyst estimates for 2016 to 2018 are shown below.

click to enlargeLVLT Proforma Revenue Split 2007 to 2018

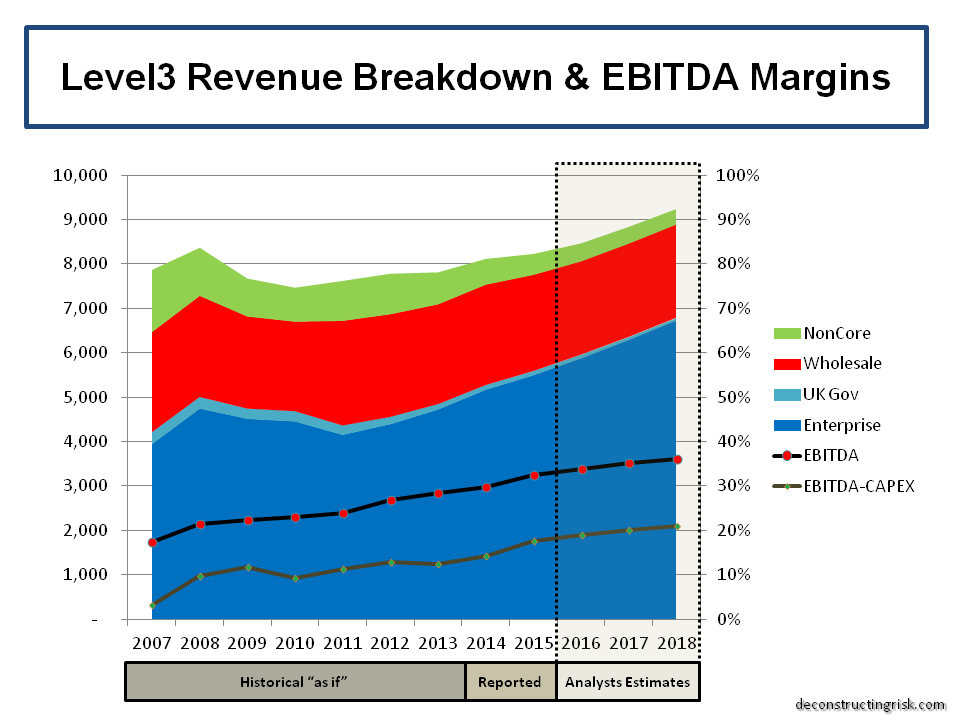
Within the context of the caveat above, the drop in enterprise revenue from 2008 to 2011 was 12.5%, primarily driven the financial crisis with other factors being Global Crossing refocusing its portfolio and the operational missteps by legacy Level3 in integrating its multiple acquisition from 2006-08. TW Telecom’s consistent top-line growth since 2007, despite the financial crisis, can be seen in this post. It’s interesting that the wholesale revenues have been relatively stable historically ranging between $2.10-2.35 billion, supporting the view that price decreases are offset by unit increases in IP traffic.

Since 2012, the benefits of scale combined with the integration prowess of the current LVLT management team (Jeff Storey became CEO in 2013) are vividly shown in the impressive increase in EBITDA margin from 22% in 2009 to 32% in 2015. After cutting capex in 2008-09, the combined business has required 14%-16% since then, now targeted at 15% to support the 8% annual growth in enterprise revenues (on a constant currency basis) that management have set as their target.

In Q4, LVLT’s revenue was derived 80% from the US and management claim that their enterprise business has only a single digit market share in the US leaving plenty of room for growth, particularly against the incumbents Verizon and AT&T. The graph below shows enterprise and wholesale revenues from each firm with AT&T showing revenue stability against a declined trend for Verizon.

click to enlargeVZ AT&T Business Telecom Revenue

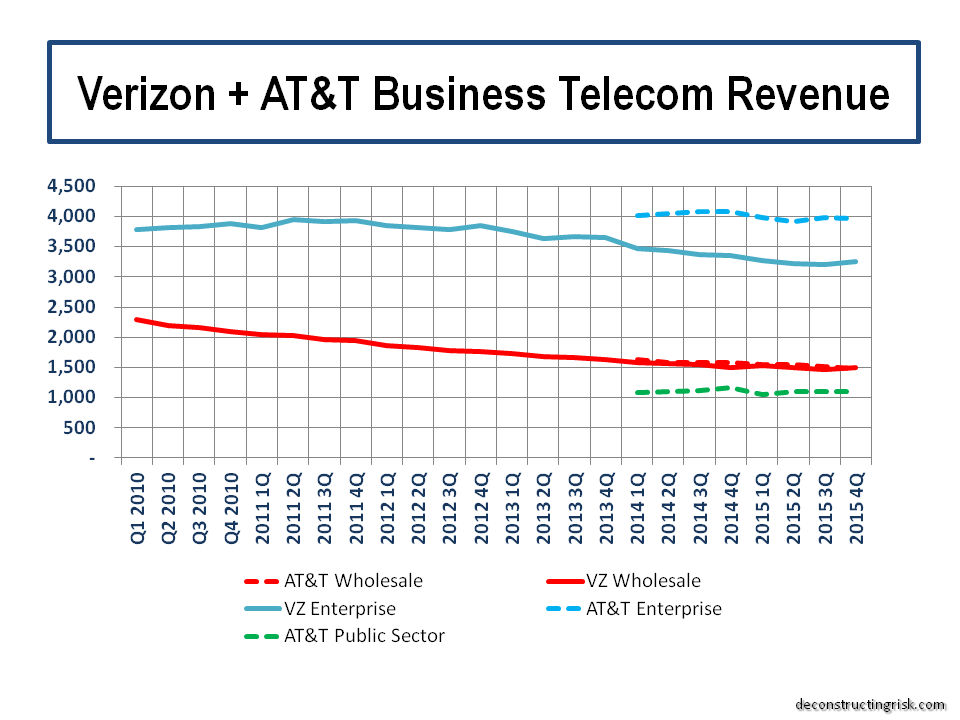
Numerous analysts confirmed their estimates on LVLT following the Q4 results and the average target is above $60, approximately 30% above the current level. Regular readers will know that normally I don’t have much time for analysts’ estimates but in this case my own DCF analysis suggests a medium term target of per share in the low 60’s is reasonable. According to my estimates that translates into an EV/EBITDA multiple of approx 8.5 in 2018 which looks reasonable given LVLT’s free cash growth. I used the historical “as if” figures above to calculate a downside valuation for LVLT on the basis of a recession occurring over the next 2 years. I assumed that a 2016-2018 recession would have approx half the impact of the 2008-2011 crisis upon LVLT’s enterprise revenue (e.g. approx 7% decline) before stabilising and recovering. My valuation of LVLT in such a scenario was in the mid 30’s or an approx 25% downside potential from Friday’s close. So at a 25% downside and a 30% upside, LVLT’s risk profile is finely balanced.

LVLT itself may become a target for a firm like Comcast or CenturyLink or another large communication firm looking to bulk up its regional reach or network business. Two interesting items came out of LVLT’s Q4 call; the first being the tightening of its target leverage range to 3 to 4 times EBITDA (from 3 to 5 times) and the second being a renewed appetite by management to use free cash-flow for disciplined M&A rather than shareholder returns such as buy-backs or even initiating a dividend. With LVLT proving their ability to get in excess of $200 million in EBITDA savings from adding TW Telecom’s revenue base of $1.6 billion at the time of the merger (or an impressive 12.5% EBITDA pick-up), the case for disciplined M&A by LVLT’s management is strong. Possible targets in the US include Zayo (their share price is having a hard time of late) or Carl Icahn’s privately held XO Communications (now that the maestro has milked the firms of its tax losses), amongst others. In Europe, possible targets include the now private Fidelity owned COLT (see this post on background) or Interroute, another privately owned pan-European network.

Whatever happens, I am content to hold my position in LVLT at this level. I like the firm’s current risk profile, the developing product range in the ever important network age, and particularly the recent execution record of management. As ever, I would highlight the stock’s volatility and recommend the use of options to protect downside risks (which are not inconsiderable if the probability of recession grows). I again repeat that LVLT is not one for the faint hearted, particularly in this market where near term volatility looks all but certain, but one I trust will be an attractive investment.

Apple below $100

In a market like this one, it’s impossible to tell what is going to happen next. The smell of fear has been in the air with greed cowered by uncertainty. Greed may push back soon with earnings, and particularly guidance, dictating the short term path whilst oil and China, amongst other macro factors, will continue to dominate the overall direction.

Overall I remain cautious on equities with a downward bias. I am sticking to my conviction stocks whilst keeping cash on the sidelines until I find a blatant bargain or two. Notwithstanding that stance, it’s always good to look at your positions and see if some risk management re-weighting is called for. And that’s the reason for a quick look over Apple before its earnings next Tuesday.

Apple is in a hapless position currently and likely has to blow away the December quarter estimates (on the number of iPhones sold, the average price, and the gross margin received) PLUS give a strong March quarter guidance to move up in a meaningful way. Given that a repeat of the outstanding results of last December’s quarter (see post here) compared to current expectations is improbable, I would suggest Apple could trade around or below $100 for a while yet. Analysts, whilst screaming about its valuation, have become increasing negative on the December quarter and guidance for their Q2 quarter. Apple may struggle to come in much above the top end of its guidance of 77.5 million iPhones (it has come in above guidance for 5 consecutive quarters albeit at a steadily reducing level above the top estimate).

The geographic split of revenue, as per the graph below, will also be closely watched to see if China’s economy is impacting Asian growth.

click to enlargeAAPL Revenue by region Q42015

Despite its best efforts, Apple remains primarily a phone company with last year’s iPhone revenues making up two-thirds of the total, as per the graph below (with my estimates for Q1).

click to enlargeAAPL Revenue by product Q42015

I played with some estimates to stress the view on an AAPL valuation below $100. Taking a jaundice view of adjusting average analyst non-GAAP estimates for 2016 and 2017 plus some pessimistic estimates of my own on 2016 and 2017 (with iPhone slowing to sales of 220 million and 200 million compared to around 230 million for 2015), I estimated the forward PEs, excluding net cash (currently around $150 billion), as per the graph below (based upon diluted GAAP EPS, not the adjusted EPS analysts love) using tonight’s close of $96.30. The multiples are quarterly point estimates using the share price one month after the quarter’s end.

click to enlargeAAPL Forward 12 Month PE Ratios Q4 2015

The graph above clearly shows the swings in sentiment on Apple over recent years as the market grapples with the future demand for the iPhone after each upgrade cycle. Tuesday will indicate whether the current concerns about iPhone sales and margins peaking are justified. Other concerns, such as a possible $8 billion tax bill from the EU, pale in comparison to those iPhone concerns. Notwithstanding these real concerns, forward multiples of below 8 look too low to me given Apple’s operating record (unless you buy into the Apple could be the next Nokia thesis which I don’t).

By way of a comparison, my estimate for a similar graph for Google is below (again using diluted GAAP EPS). Google will be another stock where earnings for Q4 will be very interesting as they split out their figures in line with the new Alphabet structure and (maybe) demonstrate again their new emphasis on cost control. Expectations look high based upon its current valuation.

click to enlargeGoogle Forward 12 Month PE Ratios Q4 2015

The comparison does reflect positively on Apple’s current valuation multiple and I’m happy to hold the AAPL position I have. A key outcome from the AAPL earnings call will be if Cook can provide sufficient catalysts for Apple’s value to trade significantly above $100.

As always, time will tell.


Follow-0n Evening 26th after earnings: Over the next few days and weeks, I’m sure the chatter about Apple and the iPhone will likely get over-bearing. The delicately posed share price of $99.99 before earnings will come under pressure. Q1 revenues were at the lower range of expectations and Q2 guidance at $50-$53 billion is weaker than expected. China revenues showed slowing growth. On the positive side, the average revenue per iPhone in Q1 was higher than expected and operating margins were strong. I revised down my estimates for AAPL’s 2016 and 2017 diluted EPS (to $9.15 and $8.60) and iPhone sales to 210 million and 190 million. The revised revenue splits and forward PE multiples (at share price of $99.99) are shown below. Thesis, as per post above, on AAPL’s valuation remains basically unchanged although the share price see some selling pressure in the short term.

click to enlargeAAPL Revenue by region Q12016

click to enlargeAAPL Revenue by product Q12016

click to enlargeAAPL Forward 12 Month PE Ratios Q1 2016.png

Wobbly Tooth

The onset of a wobbly tooth from a year old crown caused me to have a look at Sirona Dental Systems (SIRO) again. I last blogged on it in August 2014 here. SIRO has had a good run since then moving from around $80 to $109 today. The recent increase is due to the announcement in September of a merger of equals with DENTSPLY which is expected to close in Q1 2016.

SIRO, with 65% of its revenues outside of the US, felt the impact of the dollar strength with flat line revenue growth in 2015 (year ending in September). In local currencies, SIRO achieved 9.8% growth which was broad based across the US and international markets with respective growth at 9.2% and 10%. Despite the FX headwind, and a volatile Q2, operating margins were impressive, as the graph below shows. Operating cash-flow after capital expenditure has also been strong closely running at approximately 65% of operating income.

Click to enlargeSIRO Revenue Split & Op Margins YE2015

DENTSPLY (ticker XRAY) is a larger company in revenue terms with lower operating margins and a focus on dental consumable products. Dental specialty products such as endodontic (root canal) instruments and materials, implants and related products, bone grafting materials, 3D digital scanning and treatment planning software, dental and orthodontic appliances and accessories make up approximately 50% of revenues. Dental consumable products such as dental anesthetics, prophylaxis paste, dental sealants, impression materials, restorative materials, tooth whiteners and topical fluoride make up approx 30% of sales. The rest of sales are split between dental laboratory products and consumable medical device products. Geographically DENTSPLY also sells its products globally with 65% outside the US. DENTSPLY’s historical results (with assumed Q4 to December for 2015) are as below and the net cash-flow profile of DENTSPLY relative to operating income is similar to SIRO in recent years.

Click to enlargeXRAY Revenue Split & Op Margins YE2015

The investor presentation on the merger highlights further details. One interesting angle on the investment thesis is that the combined company is a good play on the aging population trend in the developed world. The $21 billion global dental market (of which the merged firm will have approximately 18%) is represented at increasing one to two times GDP. The plan also allows for a $500 million share buy-back programme post-closing with $125 million of operating costs savings (or approx 3% of operating margin based upon combined revenues) expected.

SIRO has approximately $500 million in cash with little debt. Goodwill and intangibles make up approximately 40% of SIRO’s total assets. DENTSPLY on the other hand has approximately $230 million in cash with $700 million in debt. Goodwill and intangibles make up nearly 60% of DENTSPLY’s total assets.

Based upon 5% top-line growth, my rough estimates for 2016 for the combined entity are a 21% operating margin post savings or approximately $830 million of operating income and $560 million of net income. Assuming 250 million shares (not taking the buy-back into account) I estimate an EPS of approximately $2.40. These are real back of the envelop calculations so I would caution against any rash conclusions. They do indicate a 25 times multiple of XRAY’s current share price around $60 which looks to me stretched given the integration risks. Still it’s a name for the watch list to monitor and wait for a better entry point.

In the meantime, it’s back to the dentist with this wobbly tooth.

Time for a gamble?

While waiting for earnings season to show how firms are forecasting the impact of macro trends, it’s a good time to look over some investing ideas for the future. Having a few names selected that can be picked up in market weakness is always a good way of building quality positions. It also helps in viewing current positions to see if they stack up to alternatives.

Regular readers will know that I think the insurance sector is best left alone given pricing and competitive pressures. Despite the odd look from afar, I have never been able to get comfortable with hot sectors such as the Chinese internet firms (as per this July post). The hype around new technologies such as 3D printing has taken a battering with firms like 3D Systems and Stratasys bursting the bubble. A previous post in 2014 highlighted that a focussed play on 3D printing such as Sirona Dental makes better sense to me. The Biotech sector is not one I am generally comfortable in as it seems to me to be akin to leveraged one way bets (loss making firms with massive potential trading a large multiples of revenue). Firms such as GW Pharma which are looking at commercializing cannabinoid medicines for multiple sclerosis, cancer and epilepsy have had the shine taken off their gigantic runs in the recent volatility. My views on Trinity Biotech (which is not really a biotech firm) were expressed in a recent post in May and haven’t really changed despite a subsequent 25% drop. I need to see more results from TRIB to get comfortable that the core business justifies the current valuation with the upside being in the FDA approval of the Troponin point-of-care cardiac tests. Other ideas such as online education firm Houghton Mifflin Harcourt (in this post) have failed to sparkle.

click to enlargeInvesting Ideas October 2015

This leads me to the online gambling sector that I have posted on many times (here and here for example) and specifically to the Paddy Power/Betfair merge. My interest in this sector has not been one from an investment point of view (despite highlighting that PP and Betfair would make a good combination in May!) but I can’t get the recent performance of these two firms out of my head. The graph below shows the profit before tax margins of each (with my estimate for 2015).

click to enlargePaddy Power Betfair Historical PBT Margins

One of the things that stand out is how Betfair’s margin has improved, despite the recent headwinds such as the UK point of consumption (POC) tax. Indeed the market view that Betfair CEO Breon Corcoran is the new messiah can best be illustrated in the graph below on the firm’s performance since he took charge (revenue in sterling). It shows solid revenue growth (particularly from sustainable markets) and the incredible recent growth in EBITDA margin despite the drag of 9% of EBITDA margin from the POC tax.

click to enlargeBetfair Revenue Split & EBITDA Margin to July 2015

At the most recent results, Corcoran did highlight some headwinds that would bring the margins down (e.g. phasing of marketing spend and increased product investment) but emphasised the “high level of operational gearing” in the business and the “top-line momentum”. The merger of these two high class firms under a proven management team does make one giddy with the possibilities. The brokers Davy have a price target of €129 on the Paddy Power shares (currently trading just below €100). More information should emerge as documents for the shareholder votes are published (closing date expected in Q1 2016). An investor presentation does offer some insight (for example, as per the graphic below).

click to enlargeOnline Gambling Sector

I have calculated some initial estimates of what the combined entity will look like. Using an assumed constant sterling to euro FX rate of 1.30 and trying to adjust for Betfair’s funny reporting calendar, I estimate calendar year revenue growth 2016 to 2015 at 17% assuming a sterling reporting currency, as per the split below.

click to enlargePaddy Power Betfair pro-forma revenue split

I also calculated a profit before tax margin for the combined entity of 18% which increases to 21% post cost savings. Given approx 91 million shares in the new entity, my estimated operating EPS for 2016 is therefore approx £3.85 or approx €5.00 which gives a 20 multiple to operating earnings at the Paddy Power share price around €100 today.

So is buying into the merger of two quality firms with top management in a sector that is undergoing rapid change at a multiple of 20 sensible in today’s market? That depends whether you think it’s time for a gamble or whether patience will provide a more opportune time.

Gambling Problems

It has been about 6 months since I posted on the gambling and gaming sector (also earlier here) and there has been a lot going on. BWIN, after being on the block for some time, is closing in on a sale of its business with 888 and GCV (in conjunction with PokerStars and FullTilt owner Amaya) the speculated favourites. 888 itself rejected an offer from William Hill earlier in February this year. Meanwhile, Betfair and PaddyPower opted to return their cash piles of £200 million and €440 million respectively to shareholders rather than get involved in any M&A.

Ladbrokes, after a series of poor results, promoted the digital head Jim Mullen to CEO who is currently involved in a route and branch review of the firm with the outcome due to announced in June. His first move was to put the Irish business into examinership. Ladbrokes woes have continued with poor gambling Q1 results, continuing a run of bad luck after a disastrous boxing day football gross loss, as the exhibit below shows.

click to enlarge2014 Boxing Day 11 standard deviations

As can be seen by the graph below, Breon Corcoran’s rehabilitation of Betfair’s exchange model has resulted in an outstanding performance with a near doubling of the stock. The ex-Paddy Power executive has delivered on his plans for the betting exchange (as detailed in this post). [Update: Numis just released a note on Betfair’s rich valuation as per this article.] The tiny casino player 32Red has also had a good run due to solid 2014 results and M&A speculation.

click to enlargeShare Price 6months to May 2015 William Hill Ladbrokes Paddy Power Betfair 888 BWIN 32red

Internal candidates in William Hill and Paddy Power, James Henderson and Andy McCue respectively, also took over the CEO role.

The challenges for the sector are considerable. In the UK, the point of consumption (POC) tax of 15% has been in force in the UK since December and a new 25% rate of Machine Games Duty (MGD) applied from the 1st of March. Uncertain regulation across Europe and the lack of traction in opening of US markets are other headwinds.

Operator’s ability to reduce pay-outs to punters to counter tax increases is restricted by the competitive nature of the market, particularly online as the graph below on gross win percentages illustrates.

click to enlargeOnline Sportsbook Gross Win Percentage

Taking the commentary from the operators on the impact of increased taxes, I estimated the likely impact on net margins for a number of firms (as the graph below shows).

click to enlargeNet Margin estimates to 2015 gambling firms

The market is giving Betfair and Paddy Power credit for their recent revenue growth, strong operating results, product development and strong mobile adoption. Based upon my estimates, both trade on a 2015 PE in the low 30’s.

click to enlargeMarket valuations gambling firms

A brief review of the business profile of a selection of firms illustrates the differing models, as per the exhibits below.

click to enlargeGambling Sector Revenue Split & EBITDA estimates

click to enlargeGambling Sector Revenue Geographical Split 2015

It will be fascinating to see how the remainder of 2015 plays out for this sector. Scale is undoubting going to be a strength for firms in the future. What the large UK operators, Ladbrokes and William Hill, will do to counter headwinds will be intriguing. Although there is nothing to suggest it is remotely likely, it occurs to me that a tie-up between Paddy Power and Betfair would make a powerful combination.