Tag Archives: undervalued Apple

Tech Treks

One lesson from the internet bubble is that big is beautiful in tech. But longevity is another lesson, think Yahoo! So one must be fickle in ones tech affections and one must never ever pay too much. After much patience, I was lucky enough to eventually get into Apple in early 2013 when sentiment was particularly sore. I didn’t manage to heed my own advice on getting into Google at a reasonable price in December 2014 when it was trading around 60% of its current value, as per this post on internet relative valuations (more on that post later). Since 2013, I have watched sentiment gyrate on AAPL as the standard graph I use below illustrates (most recent AAPL posts are here and here). I used the current $135 price high as the most recent data point for the Q12017 valuation.

click to enlargeaapl-forward-12-month-pe-ratios-q1-2017

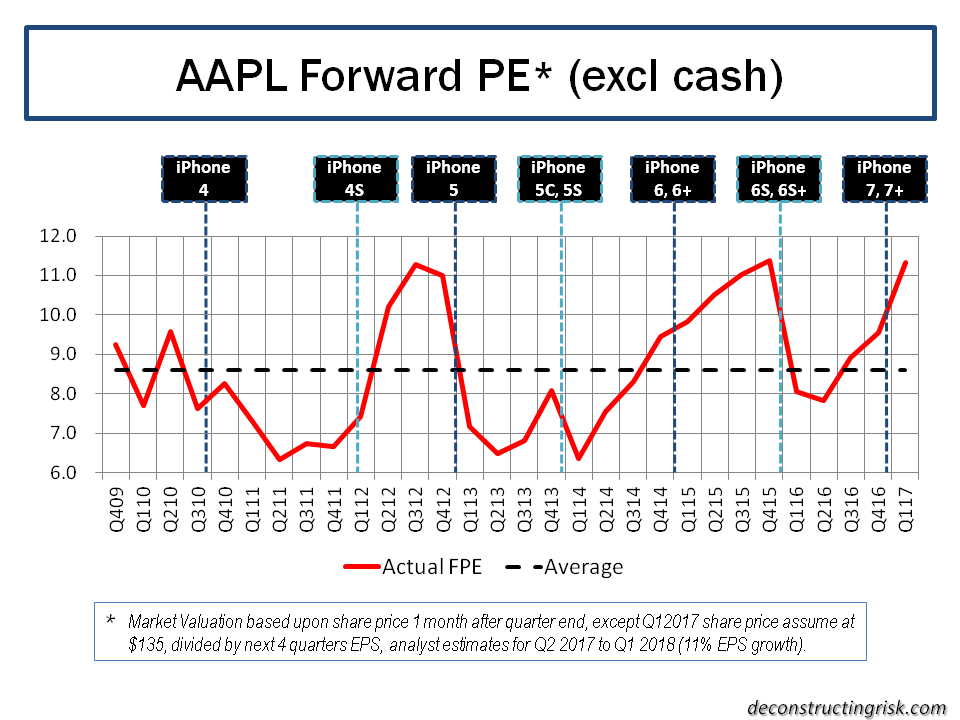
Investors and analysts seem giddy these days about the impact of Trump tax changes and the iPhone 10 year anniversary on AAPL and have been pointing to Berkshire’s position increase in AAPL as confirmation bias of more upside. I, on the other hand, have been taking some of AAPL off the table recently on valuation concerns and will likely again be a buyer when the inevitable worries return along the “one trick iPhone pony” lines. God bless gyrating sentiment! Even Lex in the FT was saying today that the current TTM PE ex net cash of 13 is reasonable (eh, a TTM PE ex net cash of 7 a year ago was more reasonable)! AAPL still has be a core holding in anybody’s portfolio but prudent risk management requires trimming at this price in my opinion.

In my search for new ideas whilst I await some divine sense to emerge from the Trump & Brexit fog, I thought it would be interesting to revisit the post referred above on internet valuations. First off, I took the graph showing forward PEs to projected EPS growth using analyst estimates from December 2014 and inserted the actual change in share price from then to now. Two notable exceptions, at the extremities, from the graph below are Amazon and Twitter with share price changes of 173% and -56% respectively.

click to enlargeinternet-multiples-dec14-as-at-feb17

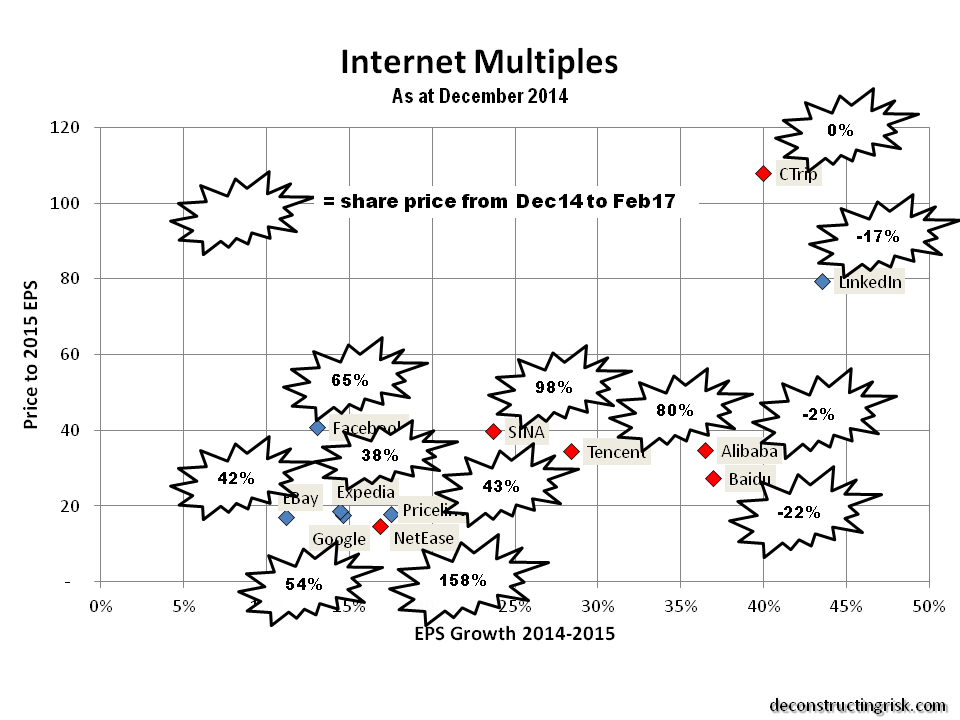
Although every company is different and has its own dynamics, my simplistic take from the graph below is that high PE stocks (e.g. > 40) with high EPS projections (e.g. > 35%) can easily run aground if the initial high growth phase hits harsh reality. The sweet spot is decent PEs with EPS growth in the 15% to 35% range (again assuming one can get comfortable that the EPS growth projections are real) indicative of the larger established firms still on the growth track (but who have successfully navigated the initial growth phase) .

A similar screen based upon today’s values and analyst estimates out to 2018 is presented below. This screen is not directly comparable with the December 2014 one as it goes out two years rather than one.

click to enlargeinternet-multiples-feb2017

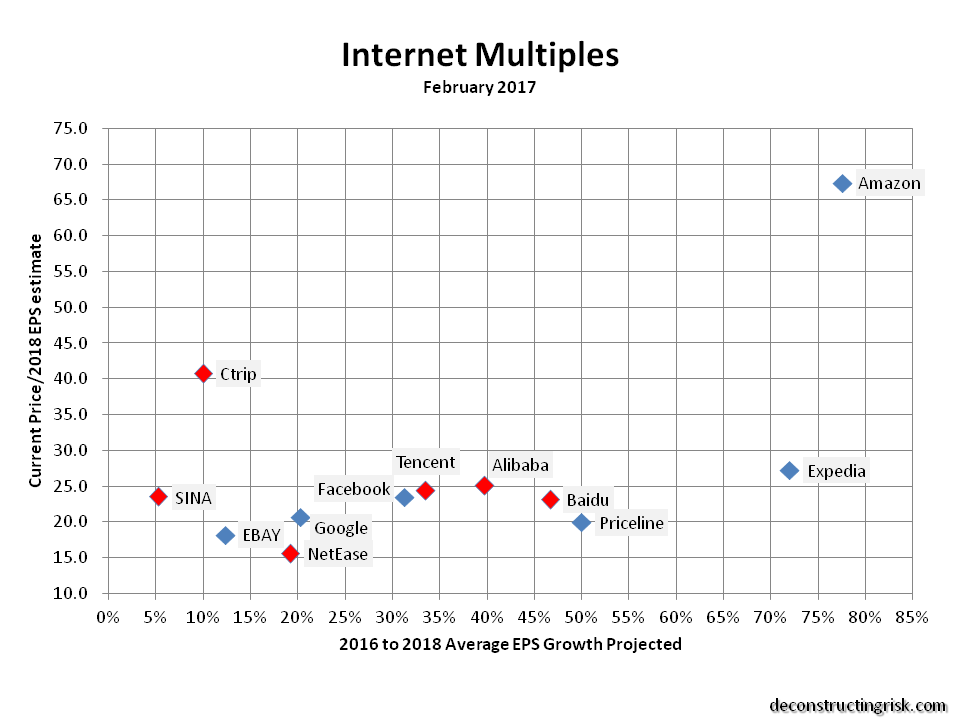
Based upon this graph, Google and Netease again look worthy of investigation with similar profiles to two years ago. Netease has the attraction of a strong growth track record with the obvious Chinese political risk to get over. Expedia looks intriguing given the strong growth projected off a depressed 2016 EPS figure. Ebay and Priceline may also be worth a look purely on valuation although I have a general aversion to retail type stocks so I doubt I’ll bother look too deeply. All of the data used for these graphs is based upon analyst estimates which also need to be validated.

Valuations currently are juicy, generally too juicy for me, so this exercise is simply one to determine who to investigate further for inclusion on a watch-list. Time permitting!

Apple below $100

In a market like this one, it’s impossible to tell what is going to happen next. The smell of fear has been in the air with greed cowered by uncertainty. Greed may push back soon with earnings, and particularly guidance, dictating the short term path whilst oil and China, amongst other macro factors, will continue to dominate the overall direction.

Overall I remain cautious on equities with a downward bias. I am sticking to my conviction stocks whilst keeping cash on the sidelines until I find a blatant bargain or two. Notwithstanding that stance, it’s always good to look at your positions and see if some risk management re-weighting is called for. And that’s the reason for a quick look over Apple before its earnings next Tuesday.

Apple is in a hapless position currently and likely has to blow away the December quarter estimates (on the number of iPhones sold, the average price, and the gross margin received) PLUS give a strong March quarter guidance to move up in a meaningful way. Given that a repeat of the outstanding results of last December’s quarter (see post here) compared to current expectations is improbable, I would suggest Apple could trade around or below $100 for a while yet. Analysts, whilst screaming about its valuation, have become increasing negative on the December quarter and guidance for their Q2 quarter. Apple may struggle to come in much above the top end of its guidance of 77.5 million iPhones (it has come in above guidance for 5 consecutive quarters albeit at a steadily reducing level above the top estimate).

The geographic split of revenue, as per the graph below, will also be closely watched to see if China’s economy is impacting Asian growth.

click to enlargeAAPL Revenue by region Q42015

Despite its best efforts, Apple remains primarily a phone company with last year’s iPhone revenues making up two-thirds of the total, as per the graph below (with my estimates for Q1).

click to enlargeAAPL Revenue by product Q42015

I played with some estimates to stress the view on an AAPL valuation below $100. Taking a jaundice view of adjusting average analyst non-GAAP estimates for 2016 and 2017 plus some pessimistic estimates of my own on 2016 and 2017 (with iPhone slowing to sales of 220 million and 200 million compared to around 230 million for 2015), I estimated the forward PEs, excluding net cash (currently around $150 billion), as per the graph below (based upon diluted GAAP EPS, not the adjusted EPS analysts love) using tonight’s close of $96.30. The multiples are quarterly point estimates using the share price one month after the quarter’s end.

click to enlargeAAPL Forward 12 Month PE Ratios Q4 2015

The graph above clearly shows the swings in sentiment on Apple over recent years as the market grapples with the future demand for the iPhone after each upgrade cycle. Tuesday will indicate whether the current concerns about iPhone sales and margins peaking are justified. Other concerns, such as a possible $8 billion tax bill from the EU, pale in comparison to those iPhone concerns. Notwithstanding these real concerns, forward multiples of below 8 look too low to me given Apple’s operating record (unless you buy into the Apple could be the next Nokia thesis which I don’t).

By way of a comparison, my estimate for a similar graph for Google is below (again using diluted GAAP EPS). Google will be another stock where earnings for Q4 will be very interesting as they split out their figures in line with the new Alphabet structure and (maybe) demonstrate again their new emphasis on cost control. Expectations look high based upon its current valuation.

click to enlargeGoogle Forward 12 Month PE Ratios Q4 2015

The comparison does reflect positively on Apple’s current valuation multiple and I’m happy to hold the AAPL position I have. A key outcome from the AAPL earnings call will be if Cook can provide sufficient catalysts for Apple’s value to trade significantly above $100.

As always, time will tell.


Follow-0n Evening 26th after earnings: Over the next few days and weeks, I’m sure the chatter about Apple and the iPhone will likely get over-bearing. The delicately posed share price of $99.99 before earnings will come under pressure. Q1 revenues were at the lower range of expectations and Q2 guidance at $50-$53 billion is weaker than expected. China revenues showed slowing growth. On the positive side, the average revenue per iPhone in Q1 was higher than expected and operating margins were strong. I revised down my estimates for AAPL’s 2016 and 2017 diluted EPS (to $9.15 and $8.60) and iPhone sales to 210 million and 190 million. The revised revenue splits and forward PE multiples (at share price of $99.99) are shown below. Thesis, as per post above, on AAPL’s valuation remains basically unchanged although the share price see some selling pressure in the short term.

click to enlargeAAPL Revenue by region Q12016

click to enlargeAAPL Revenue by product Q12016

click to enlargeAAPL Forward 12 Month PE Ratios Q1 2016.png