Tag Archives: Robert Shiller

To 2021 and beyond…

My father was not a man of many words, but when he spoke, he generally made a lot of sense. Somebody could not be called anything more derogatory by my father than to be called a clown, a term he generally used often when watching politicians on the TV. He would have had absolutely no time for the current US president, a clown of the highest order in my father’s meaning of the word. Notwithstanding the loss of life from the Capitol Hill rioting, the pantomime that played out on the 6th of January was pure theatre and showed the vacuous inevitable end destination of Trump’s narcissism (and hopefully of Trumpism). Rednecks roaming around capitol building with confederate flags and wearing silly costumes feels like a fitting end. I thought it would be months, if not years, before the doubtless shenanigans that Trump has been up to over the past 4 years (and before that, of course) would be made public in all its glory and before a large proportion of the otherwise sensible 74 million Americans who voted for him would finally see him for the “very flawed human being”, in his ex-Chief of Staff John Kelly’s wonderfully diplomatic words, that he is. My father had another word for him. There are too many issues to be dealt with that are more important than the man child who will, after this week, be a (hopefully!) much-diminished and irrelevant force.

Most people are happy to see the back of 2020 and there is little that I can add to that sentiment. Like others, I have avoided any year end round ups as it all seems too raw. My family and I have been blessed to not been adversely impacted health-wise by Covid-19 during the year. The horrible global death toll from the virus reached the grim milestone of 2 million with some pessimistic projections of the final toll at double that figure, even if mass vaccinations result in the utopian herd immunity (optimistic projections for the developed world to reach such a state by this time next year with the rest of the world taking another 12 months). It seems likely that the public health situation will get worse before it gets better.

Reaching the milestone age of 21 symbolizes the entry into adulthood, an age of maturity, and not just in relation to the legal procurement of alcohol in some countries! Maturity and long-term thinking in addressing the challenges of the coming year, including likely bottlenecks in vaccine rollouts and the rebuilding of multilateral cooperation, should replace the narrow nationalist thinking of the Trump and Brexit eras. God willing, the biblical symbolism of 21 representing the “great wickedness of rebellion and sin” will not be backdrop for the post-Covid era!

In a widely optimistic thought along the lines of rebellion and sin but without the wickedness, the post-Covid era could be characterised by a radical shift in societal norms, akin to the 60’s, where youth culture demands that the challenges of our day, specifically climate change and income equality, are addressed urgently. Combining technology with a passion for action and upsetting lifestyle norms could instigate real change. A new countercultural movement, with its own hedonistic soundtrack, would also be nice after all the introspection of lockdowns! 2020 has taught us that rapid social change can take place and we can adapt to uncertainty if we are pushed.

So back to the realities of 2021! I read recently that those of us lucky enough to be able to continue working relatively unperturbed from home during Covid having been working on average an hour a day extra and that is consistent with my experience (and thus my lack of posts on this blog!). Overcoming the challenges of the current Covid operating environment, such as avoiding the development of splintered or siloed cultures, whilst maintaining a collective corporate spirit will likely be a much-discussed topic in 2021. As the social capital of pre-Covid working networks is eroded by time and Covid fatigue, moving to a new hybrid work/office model in our new distributed working environment, whilst minimising people and talent risk, will create both challenges and opportunities for leaders and managers of differing skillsets.

One of my biggest concerns for 2021 is the financial markets. The macabre sight of stock markets hitting highs as the pandemic worsened is surely one of paradoxes of 2020. The S&P500 is currently trading at a forward PE ratio of over 22 as the graphic below shows.
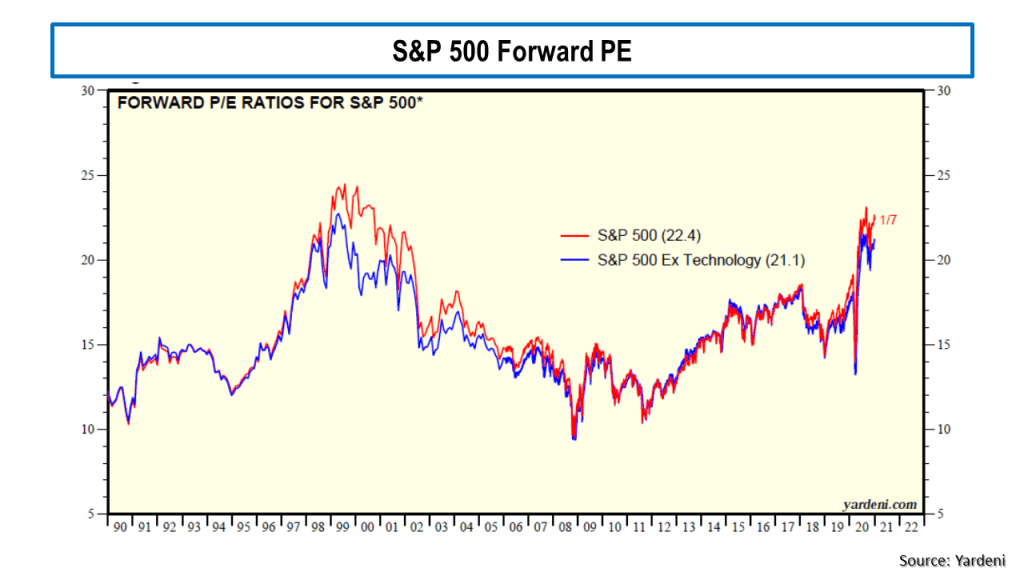
In November, the oft debated (see this post as an example) cyclically adjusted price-to-earnings (CAPE) ratio for the S&P 500 hit 33, just above the level it was at in September 1929, the month before the crash that preceded the Great Depression! CAPE has only been higher twice in history than it is now, in the late 1920’s and the early 2000’s. Apple (AAPL) is currently valued at a forward PE of over 30 (based upon its 2022 earnings estimates), trading well above the sub $100 level I pitched as fair value earlier this year (in this post). Tesla is often cited as the poster child for crazy valuations. I like to look at the newly public Airbnb (ABNB) for my example, a firm that depends upon cross border travel for its core business, which has lost $1 billion on revenue of $3.6 billion over the last 12 months (revenue down from $4.8 billion in 2019) and is now valued at $100 billion or a multiple of over 27 times sales! The market seems to be solely focussed on the upward leg and ignoring the downward leg of the so-called K shaped (bifurcated) recovery, even though small business in the US generate 44% of US economic activity. The forward PE on the Russell 2000 is above 30. In classic bubble style, speculative assets like bitcoin reached all-time highs. The latest sign is that much shorted stocks are being targeted in short squeeze trades.

This NYT article, aptly named “Why Markets Boomed in a Year of Human Misery” offers one of the clearest explanations for the market euphoria, namely that the “Fed played a big part in engineering the stabilization of the markets in March and April, but the rally since then probably reflects these broader dynamics around savings”. The broader dynamics referred to are the NPIA statistics from March to November. The article highlights that fiscal action taken to support US households through Covid support has resulted in salaries and wages only being marginally down on the prior year, despite widespread lockdowns, whilst spending has fallen. This combination pushed the US savings rate through the roof, over $1.5 trillion higher that the March to November period in 2019.

The arguments about a bubble have been rehashed of late and here are some examples:

  • In November, Robert Shiller (of CAPE fame) co-authored an article which stated “many have been puzzled that the world’s stock markets haven’t collapsed in the face of the COVID-19 pandemic and the economic downturn it has wrought. But with interest rates low and likely to stay there, equities will continue to look attractive, particularly when compared to bonds.
  • The great Martin Wolf of the FT asked (in this article) “Will these structural, decades-long trends towards ultra-low real interest rates reverse? The answer has to be that real interest rates are more likely to rise than fall still further. If so, long-term bonds will be a terrible investment. But it also depends on why real interest rates rise. If they were to do so as a product of higher investment and faster growth, strong corporate earnings might offset the impact of the higher real interest rates on stock prices. If, however, savings rates were to fall, perhaps because of ageing, there would be no such offset, and stock prices might become significantly overvalued.
  • The ever-pessimistic John Hussman responded in this market commentary that “when people say that extreme stock market valuations are “justified” by interest rates, what they’re actually saying is that it’s “reasonable” for investors to price the stock market for long-term returns of nearly zero, because bonds are also priced for long-term returns of nearly zero. I know that’s not what you hear, but it’s precisely what’s being said.
  • And the equally sunny veteran market player Jeremy Grantham opened his latest investor letter  (the wonderfully titled “Waiting for the last dance”) thus: “The long, long bull market since 2009 has finally matured into a fully-fledged epic bubble. Featuring extreme overvaluation, explosive price increases, frenzied issuance, and hysterically speculative investor behavior, I believe this event will be recorded as one of the great bubbles of financial history, right along with the South Sea bubble, 1929, and 2000.”

Grantham points out that the necessary monetary and fiscal reaction to the pandemic has created heighten moral hazard – “The longer the moral hazard runs, and you have this implied guarantee, the more the market feels it can take more risk. So it takes more risk and builds yet more debt. We’ve counted too much on the permanence and the stability of low rates and low inflation. At the end of this great cycle of stability, all the market has to do is cough. If bond yields mean-revert even partially, they will be caught high and dry.” 

I particularly liked Graham’s summary of the past 20 odd years of monetary policy –All bubbles end with near universal acceptance that the current one will not end yet…because. Because in 1929 the economy had clicked into “a permanently high plateau”; because Greenspan’s Fed in 2000 was predicting an enduring improvement in productivity and was pledging its loyalty (or moral hazard) to the stock market; because Bernanke believed in 2006 that “U.S. house prices merely reflect a strong U.S. economy” as he perpetuated the moral hazard: if you win you’re on your own, but if you lose you can count on our support. Yellen, and now Powell, maintained this approach. All three of Powell’s predecessors claimed that the asset prices they helped inflate in turn aided the economy through the wealth effect.

There is no doubt in my mind that we are in an asset price bubble currently, notwithstanding the fact that it is likely to continue for some time yet. Although not quite at the level of  Joe Kennedy hearing the shoeshine boy talk about his equity positions, I have been struck by the attitude of late of my more junior workmates when they optimistically talk about their equity and bitcoin investment gains. It’s more akin to a level of the mobsters’ spouses trading internet stock ideas in the Sopranos! The TINA trade on steroids or the TINA USP as in “there is no alternative, Uncle Sam’s paying!”.

There is little doubt that extraordinary action, both monetary and fiscal, was needed to counteract the impact of the pandemic. In the words of Andy Haldane, chief economist of the Bank of England, “now is not the time for the economics of Chicken Licken”. It is the sheer scale and reliance on government intervention into markets that surely is unhealthy in the medium to longer term. Central banks now act as market makers, distorting market dynamics such that continued newly created money chases an ever-shrinking pool of investable assets. William White, formerly of the BIS, recently commented that monetary policy has been asymmetric whereby Central banks have put a floor under markets in crises but failed to put a cap on prices in bubbles.

Fiscal stimulus has exploded the world’s government debt stocks. Fitch estimate that global government debt increased by about $10 trillion in 2020 to $78 trillion, equivalent to 94% of world GDP. The previous $10 trillion tranche took seven years to build, from 2012 to 2019. The most immediate impact has been on emerging market debt with sovereign downgrades prevalent. Kenneth Rogoff, former chief economist at the IMF, warned that “this is going to be a rocky road”. High debt levels can only be contained in the future by austerity or inflation, neither of which are pleasant and both of which would further compound high levels of inequality across the world. Covid has laid bare the destructive impact of inequality and anything that will increase inequality will inevitably impact social stability (eh, more populism anyone?). We have, of course been here before, living through it over the past 13 years, but this time the volume is up to 11.

Two other issues that will keep us occupied in 2021 are climate change and cyber risks. 2020 has recently been declared one of the hottest on record. Despite the estimated 7% fall in CO2 emissions in 2020 due to Covid lockdowns, we are still, as UN Secretary-General António Guterres highlighted this week, “headed for a catastrophic temperature rise of 3 to 5 degrees Celsius this century”. David Attenborough’s new TV programme “A Perfect Planet” illustrates the impact that the current temperature rises just above 1 degree are having right now on the delicate balance of nature. The COP26 summit in November this year must be an event where real leadership is shown if this fragile planet of ours has any hope for the long term. The other issue which will likely get more attention in 2021 is the successful cyber intrusions using Solarwinds that the Russians pulled off in 2020. An anonymous senior US official recently stated that “the current way we are doing cybersecurity is broken and for anyone to say otherwise is mistaken”.

So, 2021 promises to be another significant year, one of more change but, at least it will be without the clown (hopefully). I, for one, will eagerly wait for any signs of that new countercultural movement to take hold, whilst listening out for that hedonistic soundtrack!

A happy and healthy new year to all.

Broken Record

Whilst the equity market marches on regardless, hitting highs again today, writing about the never-ending debates over equity valuations makes one feel like a broken record at times. At its current value, I estimate the S&P500 has returned an annualised rate of nearly 11%, excluding dividends, since its low in March 2009. As of the end of September 2017, First Trust estimated the total return from the S&P500 at 18% since March 2009, as per the graph below.

click to enlarge

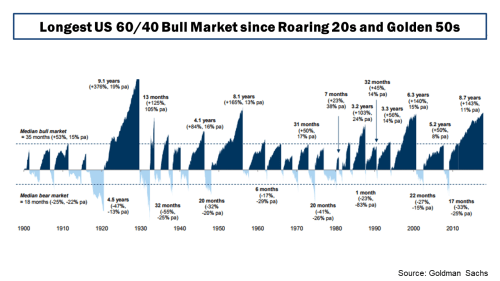
Goldman Sachs recently published an analysis on a portfolio of 60% in the S&P 500 and 40% in 10-year U.S. Treasuries, as per the graph below, and commented that “we are nearing the longest bull market for balanced equity/bond portfolios in over a century, boosted by a Goldilocks backdrop of strong growth without inflation”. They further stated that “it has seldom been the case that all assets are expensive at the same time—historical examples include the Roaring ‘20s and Golden ‘50s. While in the near term, growth might stay strong and valuations could pick up further, they should become a speed limit for returns”.

click to enlarge

My most recent post on the topic of US equity valuations in May looked at the bull and bear arguments on low interest rates and heighten profit margins by Jeremy Grantham and John Hussman. In that post I further highlighted some of the other factors which are part of the valuation debate such as the elevated corporate leverage levels, reduced capital expenditures, and increased financial risk taking as outlined in the April IMF Global Financial Stability report. I also highlighted, in my view, another influential factor related to aging populations, namely the higher level of risk assets in public pensions as the number of retired members increases.

In other posts, such as this one on the cyclically adjusted PE (CAPE or PE10), I have highlighted the debates around the use of historically applicable earnings data in the use of valuation metrics. Adjustments around changes in accounting methodology (such as FAS 142/144 on intangible write downs), relevant time periods to reflect structural changes in the economy, changes in dividend pay-out ratios, the increased contribution of foreign earnings in US firms, and the reduced contribution of labour costs (due to low real wage inflation) are just some examples of items to consider.

The FT’s John Authers provided an update in June on the debate between Robert Shiller and Jeremy Siegel over CAPE from a CFA conference earlier this year. Jeremy Siegel articulated his critique of the Shiller CAPE in this piece last year. In an article by Robert Shiller in September article, called “The coming bear market?”, he concluded that “the US stock market today looks a lot like it did at the peaks before most of the country’s 13 previous bear markets”.

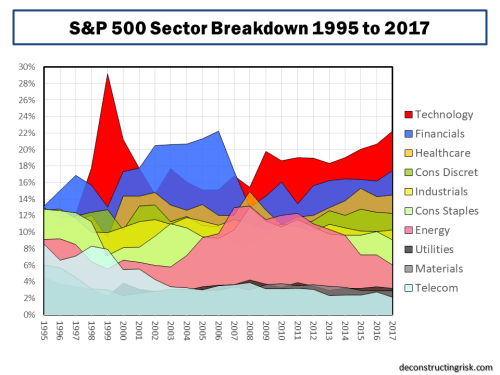
The contribution of technology firms to the bull market, particularly the so-called FANG or FAANG stocks, has also been a much-debated issue of late. The graph below shows the historical sector breakdown of the S&P500 since 1995.

click to enlarge

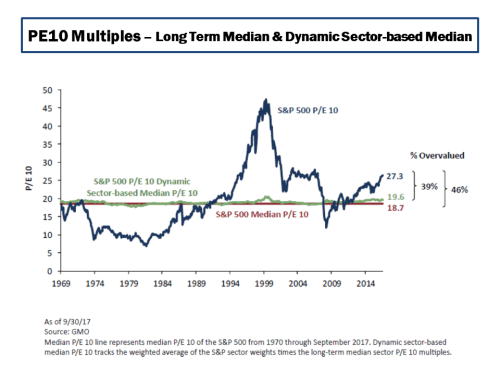
A recent article from GMO called “FAANG SCHMAANG: Don’t Blame the Over-valuation of the S&P Solely on Information Technology” tried to quantify the impact that the shift in sector composition upon valuations and concluded that “today’s higher S&P 500 weight in the relatively expensive Information Technology sector is cause for some of its expensiveness, but it does not explain away the bulk of its high absolute and relative valuation level. No matter how you cut it, the S&P 500 (and most other markets for that matter) is expensive”. The graph below shows that they estimate the over-valuation of the S&P500, as at the end of September 2017, using their PE10 measure is only reduced from 46% to 39% if re-balanced to take account of today’s sector weightings.

click to enlarge

In his recent article this month, John Hussman (who meekly referred to “his incorrectly tagged reputation as a permabear”!!) stated that “there’s no need to take a hard-negative outlook here, but don’t allow impatience, fear of missing out, or the illusion of permanently rising stock prices to entice you into entrusting your financial future to the single most overvalued market extreme in history”.

As discussed in my May post, Hussman reiterated his counter-argument to Jeremy Grantham’s argument that structurally low interest rates, in the recent past and in the medium term, can justify a “this time it’s different” case. Hussman again states that “the extreme level of valuations cannot, in fact, be “justified” on the basis of depressed interest rates” and that “lower interest rates only justify higher valuations if the stream of future cash flows is held constant” and that “one of the reasons why reliable valuation measures have retained such a high correlation with subsequent market returns across history, regardless of the level of interest rates, is that the impact of interest rates and growth rates on “terminal” valuations systematically offset each other”.

Hussman also again counters the argument that higher profit margins are the new normal, stating that “it’s important to recognize just how dependent elevated profit margins are on maintaining permanently depressed wages and salaries, as a share of GDP” and that “simply put, elevated corporate profit margins are the precise mirror-image of depressed labour compensation” which he contends is unlikely to last in a low unemployment environment.

Hussman presents a profit margin adjusted CAPE as of the 3rd of November, reproduced below, which he contends shows that “market valuations are now more extreme than at any point in history, including the 1929 and 2000 market highs”.

click to enlarge

However, I think that his profit margin analysis is harsh. If you adjust historical earnings upwards for newer higher margin levels, of course the historical earning multiples will be lower. I got to thinking about what current valuations would look like against the past if higher historical profit margins, and therefore earnings, had resulted in higher multiples. Using data from Shiller’s website, the graph below does present a striking representation of the relationship between corporate profits (accepting the weaknesses in using profits as a percentage of US GDP) and interest rates.

click to enlarge

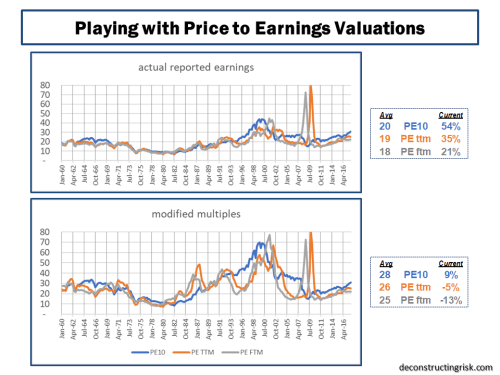
Purely as a thought experiment, I played with Shiller’s data, updating the reported earnings for estimates through 2018 (with a small discount to reflect over-zealous estimates as per recent trends of earnings revisions), recent consensus end 2018 S&P500 targets, and consensus inflation and the 10-year US interest rates through 2018. Basically, I tried to represent the base case from current commentators of slowly increasing inflation and interest rates over the short term, with 2018 reported EPS growth of 8% and the S&P500 growing to 2,900 by year end 2018. I then calculated the valuation metrics PE10, the regular PE (using trailing twelve month reported earnings called PE ttm), and the future PE (using forward twelve month reported earnings called PE ftm) to the end of 2018. I further adjusted the earnings multiples, for 2007 and prior, by applying an (principally upward) adjustment equal to a ratio of the pre-2007 actual  corporate profits percentage to GDP divided by a newly assumed normalised percentage of 8.5% (lower than the past 10-year average around 9% to factor in some upward wage pressures over the medium term). The resulting historical multiples and averages are shown below.

click to enlarge

Based upon this analysis, whilst accepting its deeply flawed assumptions, if 2018 follows the base case currently expected (i.e. no external shocks, no big inflation or interest rates moves, steady if not spectacular earnings growth), the S&P500 currently looks over-valued by 50% to 20% using historical norms. If this time it is different and higher profit margins and lower interest rates are the new normal, then the S&P500 looks roughly fairly-valued and current targets for 2018 around 2,900 look achievable. Mind you, it’s a huge leap in mind-set to assume that the long-term average PE is justifiably in the mid-20s.

I continue to be concerned about increasing corporate leverage levels, as highlighted in my May post from the IMF Global Financial Stability report in April, and the unforeseen consequences of rising interest rate after such a long period of abnormally low rates.

In the interim, to paraphrase an ex-President, it’s all about the earnings stupid!

An ice age or a golden one?

The debate on whether the US stock market is overvalued, as measured by the cyclically adjusted price to earnings ratio (CAPE) as developed by Robert Shiller, or whether CAPE is not relevant due to weaknesses in comparing past cycles with today’s mixed up macro-economic world, continues to rage. I have posted several times on this, most recently here and here. In an article in this week’s Economist, Buttonwood outlines some of the bull and bear arguments on the prospects for US corporate growth and concludes that “America is an exception but not as big an exception as markets suggest”.

Bulls argue that, although the CAPE for the S&P500 is currently historically high at 26.5, earnings growth remains strong as the US economy picks up speed and that at a forward PE around 16 the S&P500 is not at excessive levels indicative of a bubble. The latest statistics compiled by the excellent Yardeni Research from sources such as the Bureau of Economic Analysis show that earnings, whether S&P reported or operating earnings or NIPA after tax profits from current production or based upon tax returns, continue to trend along a 7% growth projection. Jim Paulsen, chief investment strategist at Wells Capital Management, believes that “this recovery will last several more years” and “earnings will grow”. Even the prospect of increased US interest rates does not perturb some bulls who assert that rates will remain low relative to history for some time and that S&P500 firms still have plenty of cash with an aggregate cash-pile of over $1 trillion. The king of the bulls, Jeremy Siegel recently said that “If you look at history, the bull markets do not end when the Fed starts raising interest rates. Bull markets could go on for another 9 months to 2 years“.

Bears point to high corporate profits to GDP and argue that they are as a direct result of low real wages and are therefore unsustainable when normal macro conditions return. Others point to the surge in share buybacks, estimated at nearly $2 trillion by S&P500 firms since 2009, as a significant factor behind EPS growth. Société Générale estimate a 20% fall in Q2 buybacks and (the always to be listened to) Andrew Lapthorne warns that as debt gets dearer firms will find it hard to maintain this key support to stock prices as in the “absence of the largest buyers of US equity going forward is likely to have significant consequence on stock prices”. The (current) king of the bears, Albert Edwards, also at SocGen, provided good copy in a recent report “Is that a hissing I can hear?” saying that “companies themselves have been the only substantive buyers of equity, but the most recent data suggests that this party is over and as profits also stall out, the equity market is now running on fumes“. Edwards believes that an economic Ice Age is possible due to global deflationary pressures. Another contender for king of the bears is fund manager John Hussman and he recently commented: “make no mistake, this is an equity bubble, and a highly advanced one“.

One commentator who I also respect is the author behind the excellent blog Philosophical Economics. A post last month on CAPE highlighted the obvious but often forgotten fact thatthe market’s valuation arises as an inadvertent byproduct of the equilibriation of supply and demand: the process through which the quantity of equity being supplied by sellers achieves an equilibrium with the quantity of equity being demanded by buyers”. As such, the current macro-economic situation makes any reference to an average or a “normal period” questionable. The post is well worth a read and concludes that the author expects the market to be volatile but continue its upward trajectory, albeit at a slower pace, until signs that the real economy is in trouble.

For me, the easy position is to remain negative as I see valuations and behaviour that frightens me (hello AAPL?). I see volatility but not necessarily a major correction. Unless political events get messy, I think the conclusion in a previous Buttonwood piece still holds true: “investors are reluctant bulls; there seems no alternative”. Sticking only to high conviction names and careful risk management through buying insurance where possible remain my core principles. That and trying to keep my greed in check…..

MGI Global Flows In A Digital Age Report

McKinsey Global Institute has an interesting report out entitled “Global flows in a digital age: How trade, finance, people, and data connect the world economy”. The report goes into different aspects of flows across the globe with a central assertion as follows:

Two major forces are now accelerating the growth and evolution of global flows. The first is increasing global prosperity. By 2025, 1.8 billion people around the world will enter the consuming class, nearly all from emerging markets, and emerging-market consumers will spend $30 trillion annually, up from $12 trillion today. This will create enormous new hubs for consumer demand and global production. The second major force is the growing pervasiveness of Internet connectivity and the spread of digital technologies. More than two-thirds of us have mobile phones. In 2012, there were 2.7 billion people connected to the Internet. A torrent of data now travels around the world. Cross-border Internet traffic grew 18-fold between 2005 and 2012.

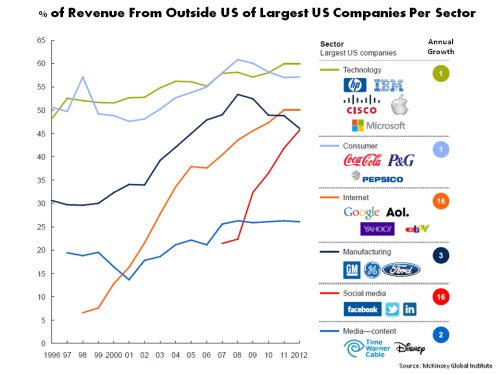
One graph in the report that caught my attention was the one below of the growth in foreign revenues from top US firms across different sectors. This is interesting and feeds directly into some of the contentions asserted by Jeremy Siegel in justifying a high CAPE ratio (as discussed in this post).

click to enlargeMGI Revenue % of US firms from foreign markets

What is interesting about the graph above is the fall in the manufacturing firms since the financial crisis and the relatively slow growth of revenues outside of the US from the “established” technology and consumer firms in the US. Given the growth in global flows, it suggests they need to be more focused on the opportunities outside the US, particularly if the graph below on future consumption in 2025 turns out to accurate.

click to enlargeMGI emerging economies per capita GDP

I was particularly taken with the pieces of the report in relation to the impact of the internet and e-commerce. The following extract highlighted the impact:

“The power of digitization comes especially from its marginal cost economics that reduce costs associated with access, discovery, and distribution of goods and services to nearly zero. As a result, the cost of participating in flows is lowered for individuals, small firms, and entrepreneurs. This is already leading not only to innovations in business models but also to the emergence of micromultinationals, microwork, and microsupply chains that are able to tap into global opportunities. This significantly removes barriers to participating in global flows, broadening opportunities. It also will put pressure on all companies to innovate their business models to capture the opportunities and respond to new sources of competition, and to counter the pressure on their existing business models from digitization’s marginal-cost economics.”

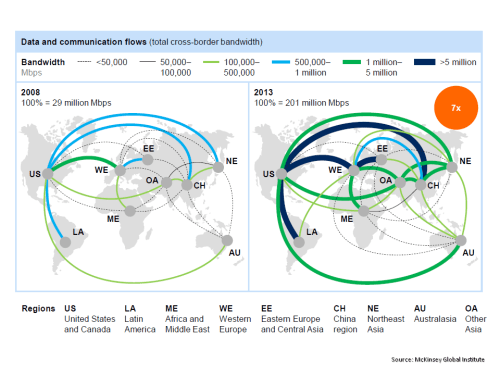
The graph below shows the changes in data and communication flows over the past 5 years. The growth in traffic between the US and China and between the US and Latin America is noteworthy.

click to enlargeMGI data & communication change 2008 to 2013

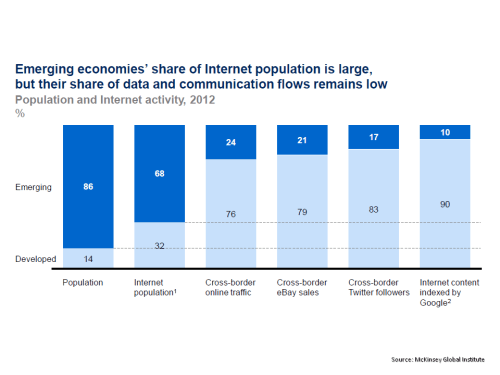
The report does highlight that emerging economies lag significantly behind developed economies in cross-border internet traffic with impediments to growth such as high bandwidth prices and IP transit costs. The graph below highlights the dominance of the developed economies in areas such as content and online sales.

click to enlargeMGI emerging economies Internet & Data

It does however also show how things may grow as emerging economies take advantage of the power of the wired world. As the report states: “the pace of change is likely to accelerate even more dramatically as more of the world goes online”.

There is some other interesting stuff in the MGI report and its worth a quick read.

Carry on CAPE

The debates on the cyclically adjusted PE (CAPE), developed by recent Nobel Prize winner Robert Shiller, as a market valuation indicator continue to rage. My last post on the subject is indicative of where I left the arguments.

A variation on Jeremy Siegel’s arguments against CAPE was put forward in an interesting post on the blog Philosophical Economics (hereinafter referred to as PE), centred on the failure of CAPE to mean revert through the ups and downs of the past 23 years and the need for a consistent measure for earnings in the PE calculation across historical reference periods.

The first point essentially relates to the time period over which CAPE is relevant for today’s global economy. Shiller uses available S&P reported GAAP earnings dating back to the 1936 and has supplemented them with his own GAAP earnings calculations from 1936 back to 1871. PE makes the point that historical periods which are “distorted by world wars (1914-1918, 1939-1945, 1950-1953), gross economic mismanagement (1929-1938), and painfully high inflation and interest rates (1970-1982)” may not be the most appropriate as a reference period for today (as reflective of the changed macro-economic period covering the so called great moderation). In essence, PE is saying that structural changes in the economy and investor sophistication may justify a shorter and more relevant time period (yes, PE admits it is a flavour of the “this time it’s different” argument!).

On earnings, PE repeats many of Siegel’s arguments. For example, the point is again made about asymmetric accounting changes to intangible write downs from FAS 142/144. In addition, PE also highlights the lower dividend payouts of 34% over the past 18 years compared to 52% over the 40 year period between the mid-50s and mid-90s. PE argues that lower dividend yields indicate higher investment by firms and therefore support the argument that historical comparisons may not be as relevant.

PE uses Pro-Forma (non-GAAP) S&P earnings from 1954 as reported by Bloomberg for earnings (as opposed to Siegel’s use of National Income and Product Accounts (NIPA) earnings for all approx 9,000 US corporations) and stresses that these earnings may not necessarily be more applicable but they are at least consistent. PE shows that using these earnings since 1954 the market (as at December 2013) was only modestly above the geometric mean and further supports the use of Pro-Forma earnings by back testing this metric against CAPE as an indicator of value through the financial crisis.

A counter-argument (in a December paper) from Bill Hester of Hussman Funds centred on differences in the Bloomberg Pro-Forma earnings used in PE’s calculations, arguing that from 1988 to 1998 the earnings reported by Bloomberg are a mixture of reported & operating earnings and that from 1998 they are akin to operating earnings. The argument highlights the problem of data quality in many databases which are commonly used in the market creating a source of systematic risk. [As an aside, on an individual stock basis, I have found issues with data from commonly used databases and that is why I always take my historical figures from published accounts – not that they are without any issues, just try reconciling some of AIG’s historical financial statements given the almost annual restatements!]. On earnings, Hestor uses work done by Andrew Smithers in his book “The Road to Recovery” which suggests that executive compensation tied to short term results has been a factor in earnings volatility.

PE counters Hester’s counter argument in another post that after adjusting the Boomberg data pre-1998 and applying an adjustment for the change in dividend payout ratio the ProForma earnings based CAPE still signals a less overvalued market that Shiller’s CAPE. PE also rubbishes the contention from Smithers that volatility is as a result of executive remuneration saying that low volatility is in the executive’s interest to maximise their options which vest over time and that investment is currently low due to the uncertainty around unprecedented macro- economic risks.

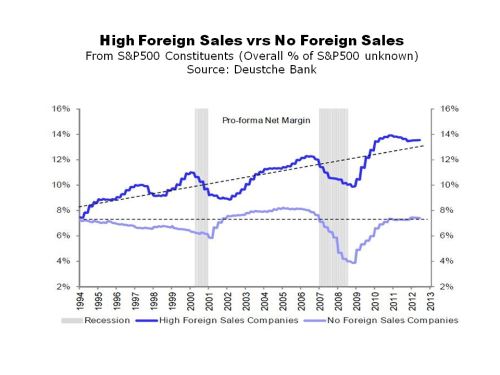
PE cites arguments similar to those of other bulls such as Siegel who content that US corporate profits as a percentage of GDP (or GNP) is high compared to historical levels due to increased foreign contributions to profits, lower corporate taxes and a higher S&P concentration of globalised technology and energy firms with fatter profit margins. PE points to stability in statistics such as S&P 500 net profit margins for non-financials (excluding energy & technology) produced by BoA Merrill Lynch and analysis of David Bianco from Deutsche Bank on firms with a high level of foreign sales showing higher profit margins (see graph reproduced below). To be fair to Bianco, he recently maintained his year-end 2014 S&P500 target of 1850 and warning of volatility in 2014 stating “buy the dips, but I’m also saying in advance, wait for the dips“.

click to enlargeDeutsche Bank Foreign vrs Domestic Profit MarginsIn a December note, the extremely bearish John Hussman stated that “in recent years, weak employment paired with massive government deficits have introduced a wedge into the circular flow, allowing wages and salaries to fall to the lowest share of GDP in history, even while households have been able to maintain consumption as the result of deficit spending, reduced household savings, unemployment compensation and the like”. In another note from John Hussman out this week on foreign profits, based upon a range of valuation metrics (see graph reproduced below) he puts the S&P500 at a 100% premium to the level needed to achieve historical normal returns (or indicating a negative total return on horizons of 7 years or less). He also rubbishes the higher contribution from foreign profits, saying they have been decreasing since 2007 and that they “do not have any material role in the surge in overall profit margins”.

click to enlargeHussman S&P500 Valuation March 2014The (only) slightly more cheerful folk over at GMO also had an insightful paper out in February by James Montier on the CAPE debate. One of the more interesting pieces of analysis in the paper was a Kalecki decomposition of profits which indicate that the US government deficit is a major factor in replacing reduced investment since the crisis (see graph reproduced below). As we know, this US deficit is in the process of being run down and the knock on impact upon profits could result (save a recovery in investment or a significant re-leveraging of households!). The Kalecki composition also seems to support the larger contributions from foreign earnings (albeit a decreasing contribution in recent years).

click to enlargeGMO Kalecki DecompositionDepending upon whether you use the S&P500 PE, the Shiller PE or the NIPA based PE since 1940 the market, according to Montier, is 30%, 40% or 20% overvalued respectively.  Using a variety of metrics, Montier estimates that the expected total return (i.e. including dividends) for the market over the next 7 years ranges from an annual return of 3.6% from Siegel’s preferred method using NIPA to a negative 3.2% per annum from a full revision Shiller PE (using 10 year trend earnings rather than current trailing 10 year earnings).  The average across a number of valuation metrics suggests a 0% per annum return over the next 7 years!

Ben Inker also has a piece in the February GMO letter on their strategy of slowly averaging in and out of the market. Inker calls it slicing whereby you take account of historical forecasts as well as your current “spot” view of valuations. Their research shows that you capture more value through averaging purchasing or selling over time by benefiting from market momentum. GMO currently are in selling mode whereby they “are in the process of selling our equity weight down slowly over the next 9 to 12 months”.

So, where do all of these arguments leave a poor little amateur investor like me? Most sensible metrics point to the S&P500 being overvalued and the only issue is quantum. As I see it, there is validity on both sides of the CAPE arguments outlined above. Earnings are high and are likely to be under pressure, or at best stable, in the medium term. I am amenable to some of the arguments over the relevant timeframe used to calculate the mean to assess the mean reverting adjustment needed (I do however remain wedded to mean revision as a concept).

To me, the figures of 20% to 40% overvaluation in Montier’s note based on calculations back to 1940 from different CAPE calculations feel about right. A 30% overvaluation represents the current S&P500 to a mean calculated from 1960. The rapid bounce back in the S&P500 from the 5% January fall does show how resilient the market is however and how embedded the “buy on the dip” mentality currently is. GMO’s philosophy of averaging in and out of the market over time to take advantage of market momentum makes sense.

In the absence of any external shock that could hit values meaningfully (i.e. +15% fall), the market does look range bound around +/- 5%. Common sense data points such as the Facebook deal for WhatsApp at 19 times revenues confirm my unease and medium term negative bias. I have cut back to my core holdings and, where possible, bought protect against big pull backs. In the interim, my wish-list of “good firms/pity about the price” continues to grow.

They say that “the secret to patience is doing something else in the meantime”. Reading arguments and counter argument on CAPE is one way to pass some of the time…….