Tag Archives: Lloyds of London

Not all insurers’ internal models are equal

Solvency II is a worn out subject for many in the insurance industry. After over 10 years of in depth discussions and testing, the current target date of 01/01/2016 remains uncertain until the vexed issue of how long term guarantees in life business is resolved.

The aim of the proposed Solvency II framework is to ensure that (re)insurers are financially sound and can withstand adverse events in order to protect policy holders and the stability of the financial system as a whole. Somewhere along the long road to where we are now, the solvency capital requirement (SCR) in Solvency II to achieve that aim was set at an amount of economic capital corresponding to a ruin probability of 0.5% (Value at Risk or VaR of 99.5%) and a one year time horizon.

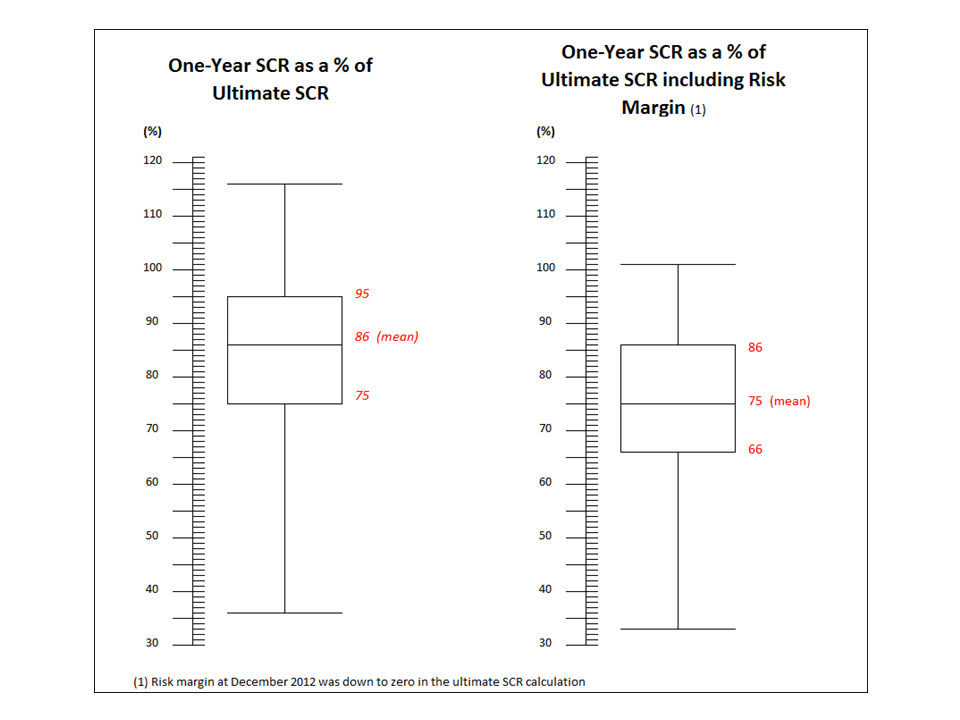
Many global reinsurers and insurers now publish outputs from their internal models in annual reports and investor presentations, most of which are set at one year 99.5% VaR or an equivalent level. Lloyds’ of London however is somewhat different. Although the whole Lloyds’ market is subject to the one year Solvency II calibration on an aggregate basis, each of the Syndicates operating in Lloyds’ have a solvency requirement based upon a 99.5% VaR on a “to ultimate” basis. In effect, Syndicates must hold additional capital to that mandated under Solvency II to take into account the variability in their results on an ultimate basis. I recently came across an interesting presentation from Lloyds’ on the difference in the SCR requirement between a one year and an ultimate basis (which requires on average a third more capital!), as the exhibit below reproducing a slide from the presentation shows.

click to enlarge

SCR one year ultimate basis

Although this aspect of Lloyds’ of London capital requirements has not been directly referenced in recent reports, their conservative approach does reflect the way the market is now run and could likely be a factor behind recent press speculation on a possible upgrade for the market to AA. Such an upgrade would be a massive competitive plus for Lloyds’.

Underwriting and Credit Cycle Circles

An article from Buttonwood in March reviewed a book by Thomas Aubrey – “Profiting from monetary policy – investing through the business cycle”. Aubrey argues that credit cycles are better predictors of equity and asset prices rather than economic growth. Differentials between the cost of capital and the return on capital drive capital supply.

In previous presentations on the insurance sector and the factors affecting underwriting cycles, I have used the credit cycle as an explanation for demand and supply imbalances. Given the current influx of yield seeking capital into the wholesale insurance market, by way of new risk transfer mechanisms in the ILS sector, and the irrational cost of capital driven by loose monetary policy around the world, Aubrey’s arguments make sense.

Using the calendar year combined ratios of the Lloyds of London insurance market as a proxy for the wholesale market, discounting such ratios at the risk free rate for each year with an assumed payout duration, and comparing these to an index of S&P defaults by origination year illustrates the relationship.

Underwriting & Credit CyclesThe more recent impact of natural catastrophes from 2005 and 2011 illustrates the higher concentration of shorter tail business lines in the past decade as interest rate reductions make longer tail lines less attractive.

Of course, no one factor drives the insurance cycle and there may be a degree of circularity in this picture. Many of the losses at Lloyds in the 1980s and 1990s came from asbestos and pollution claims, issues which drove many companies into insolvency. There is also a circularity between the insurance losses from the events of 9/11 and the economic impact following the bursting of the internet bubble. In addition, there are limitations in comparing calendar year ratios which includes reserve deterioration (particularly from asbestos years) against defaults by origination. Notwithstanding these items, it’s an interesting graph!