Tag Archives: accident year basis

Historical CAT Insured Losses – an update.

I was recently doing some research on the specialty insurance sector again, a topic I posted regularly on in the past. I googled historical insured catastrophe losses and a response from Google’s AI model Gemini included an old exhibit I had posted on this blog in 2013. I am in two minds about the result, chuffed that something I posted 12 years ago is still being used but perplexed why an exhibit that was so out of date would be relevant! A subject for another day…..

Anyway, the below exhibit updates the inflated insured catastrophe losses from 1990 to 2024 (with Swiss Re’s estimate for 2025). The trend is clearly upwards with the new 10-year average at $130 billion and the 5-year average at $140 billion. This is a significant change from the $60 billion 10 year average in the 2013 post!

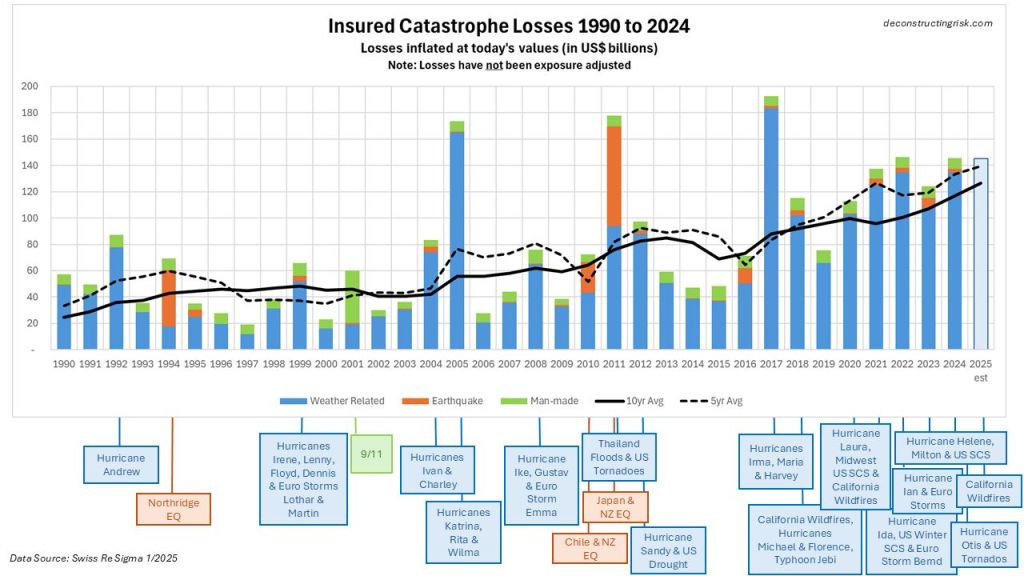
As I have highlighted many times previously here, inflated losses (i.e. bringing historical costs into today’s value) are not a true indicator of current risks as the historical losses need to be exposure adjusted (i.e. historical events run through models with today’s exposure date).

An excellent recent example of this is from a recent paper by Karen Clark & Co called “The $100 Billion Hurricane” which runs each historical US hurricane through 2025 exposures, as below.

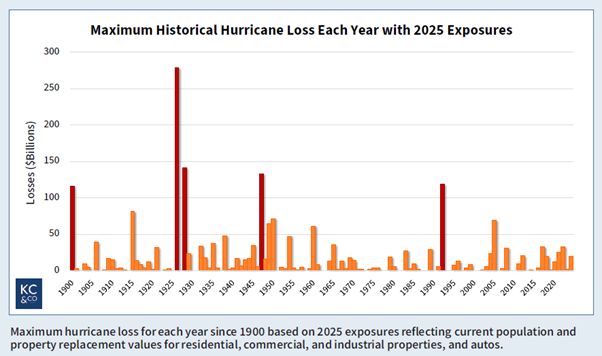
The paper concludes that “there is no significant upward trend in hurricane losses, and the US has been lucky over the past few decades”.

Two different angles of looking at historical data albeit that it’s undeniable that catastrophe losses, both by economic and insured value, in aggregate each year are only going in one direction.

Let’s hope the remainder of the 2025 US hurricane season doesn’t show us that the single $100 billion hurricane loss was overdue!

​​​​

Another look across insurance cycles

Following on from a previous post on insurance cycles and other recent posts, I have been looking over the inter-relationship between insurance cycles in the US P&C market, the Lloyds of London market and the reinsurance market. Ideally, the comparisons should be done on an accident year basis (calendar year less prior year reserve movements) with catastrophic/large losses for 2001/2005/2011 excluded but I don’t (yet) have sufficient historical data to make such meaningful comparisons.

The first graph shows calendar year combined ratios in each of the three markets. The US P&C figures contain both consumer and commercial business and as a result are less volatile with the other markets. For example, Lloyds results are from specialty business classes like energy, marine, credit & surety, A&H, specialty casualty, excess and surplus (E&S) lines and reinsurance. The reinsurance ratios are those for most reinsurers as per S&P in their annual global reports. For good measure, I have also included the US real interest rates to show the impact that reduced investment income is having on the trend in combined ratios across all markets. Overall, ratios have been on a downward trend since the early 1990s. However, if catastrophic losses and reserve releases are excluded ratios have been on an upward trend since 2006 across Lloyds and the reinsurance markets. Recent rate increases in the US such as the high single digit rate increases in commercial property & workers comp (see Aon Benfield January report for details on US primary rate trends) may mean that the US P&C market comes in with a combined ratio below 100% for the full 2013 year (from 102% and 106% in 2012 and 2011 respectively).

click to enlargeInsurance Cycle Combined RatiosAs commented on above, the US P&C ratios cover consumer and commercial exposures and don’t fully show the inter-relationship between the different business classes across that market. The graph below shows the calendar year ratios in the US across the main business classes and paint a more volatile picture than the red line above.

click to enlargeUS Commercial Business Classes Combined Ratios