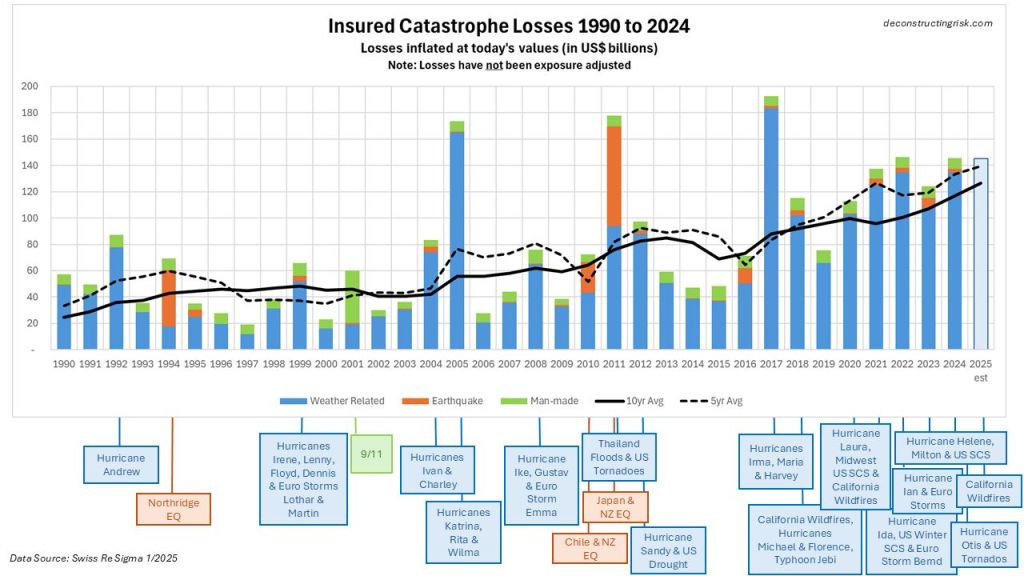
Quarterly reports from Willis Re and Aon Benfield highlight the impact on US catastrophe pricing from the new capital flowing into the insurance sector through insurance linked securities (ILS) and collaterised covers. Aon Benfield stated that “clients renewing significant capacity in the ILS market saw their risk adjusted pricing decrease by 25 to 70 percent for peak U.S. hurricane and earthquake exposed transactions” and that “if the financial management of severe catastrophe outcomes can be attained at multiple year terms well inside the cost of equity capital, then at the extreme, primary property growth in active zones could resume for companies previously restricting supply”.
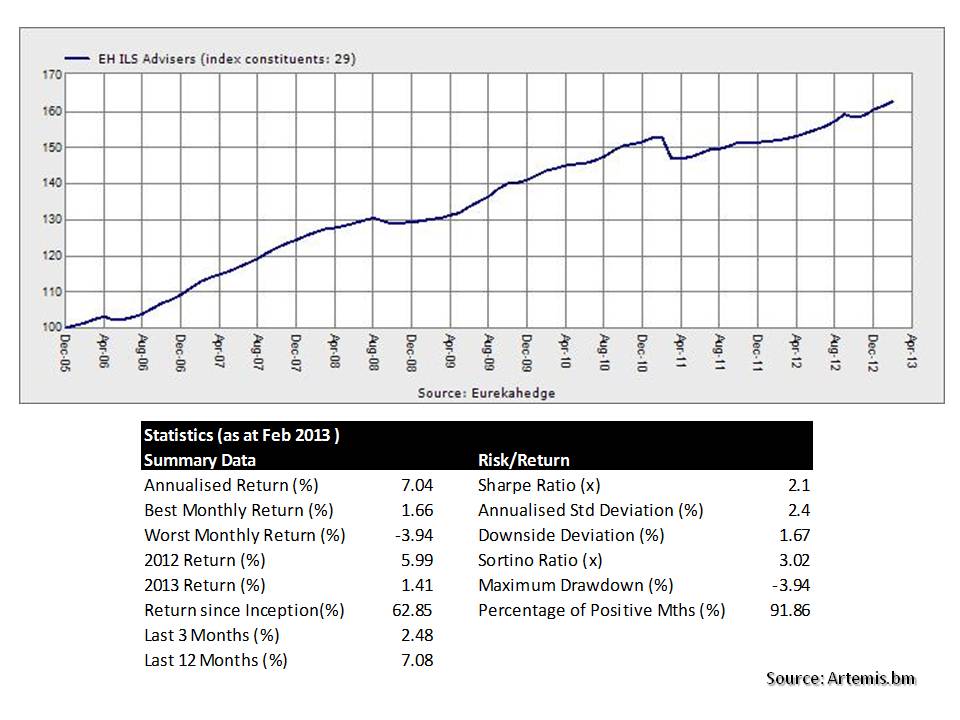
This represents a worrying shift in the sector. Previously, ILS capacity was provided at rates at least equal to and often higher than that offered by the traditional market. The rationale for a higher price made sense as the cover provided was fully collaterized and offered insurers large slices of non-concentrated capacity on higher layers in their reinsurance programmes. The source of the shift is significant new capacity being provided by yield seeking investors lured in by uncorrelated returns. The Economist’s Buttonwood had an article recently entitled “Desperately seeking yield” highlighting that spreads on US investment grade corporate bonds have halved in the past 5 years to about 300bps currently. Buttonwood’s article included Bill Gross’s comment that “corporate credit and high-yield bonds are somewhat exuberantly and irrationally priced”. As a result, money managers are searching for asset classes with higher yields and, by magic, ILS offers a non-correlating asset class with superior yield. Returns as per those from Eurekahedge on the artemis.bm website in the exhibit below highlight the attraction.
 Such returns have been achieved on a limited capacity base with rationale CAT risk pricing. The influx of new capital means a larger base, now estimated at $35 billion of capacity up from approximately $5 billion in 2005, which is contributing to the downward risk pricing pressures under way. The impact is particularly been felt in US CAT risks as these are the exposures offering the highest rate on lines (ROL) globally and essential risks for any new ILS fund to own if returns in excess of 500 bps are to be achieved. The short term beneficiaries of the new capacity are firms like Citizens and Allstate who are getting collaterised cover at a reduced risk premium.
The irony in this situation is that these same money managers have in recent years shunned traditional wholesale insurers, including professional CAT focussed firms such as Montpelier Re, which traded at or below tangible book value. The increase in ILS capacity and the resulting reduction of risk premia will have a destabilising impact upon the risk diversification and therefore the risk profile of traditional insurers. Money managers, particularly pension funds, may have to pay for this new higher yielding uncorrelated asset class by taking a hit on their insurance equities down the road!
Financial innovation, yet again, may not result in an increase in the size of the pie, as originally envisaged, but rather mean more people chasing a smaller “mispriced” pie. Sound familiar? When thinking of the vast under-pricing of risk that the theoretical maths driven securitisation innovations led to in the mortgage market, the wise words of the Buffet come to mind – “If you have bad mortgages….they do not become better by repackaging them”. Hopefully the insurance sector will avoid those mistakes!