
So, the February dip in the equity market is but a memory with the S&P500 now in positive territory for the year. With the forward PE at 16.4 and the Shiller CAPE at 25.75, it looks like the lack of alternatives has, once again, brought investors back to the equity market. As Buttonwood puts it – “investors are reluctant bulls; there seems no alternative.” A December report from Bank of England staffers Rachel and Smith (as per previous post) has an excellent analysis of the secular drivers on the downward path of real interest rates. I reproduced a sample of some of the interesting graphs from the report below.
click to enlarge
In the course of a recent conversation with a friend on the lack of attractive investment opportunities the subject of insurance linked securities (ILS) arose. My friend was unfamiliar with the topic so I tried to give him the run down on the issues. I have posted my views on ILS many times previously (here, here and here are just a recent few). During our conversation, the question was asked how low is current pricing in the catastrophe market relative to the “technically correct” level.
So this post is my attempt at answering that question. On a back of the envelop basis (I am sure professionals in this sector will be appalled at my crude methodology!). Market commentary currently asserts that non-US risks are the more under-priced of the peak catastrophe risks. Guy Carpenter’s recent rate on line (ROL) regional index, which is a commonly used industry metric for premium as a percentage of limit, shows that US, Asian, European and UK risks are off 30%, 28%, 32% and 35% respectively off their 2012 levels.
Using the US as a proxy for the overall market, I superimposed the Guy Carpenter US ROL index over historical annual US insured losses (CPI inflation adjusted to 2015) as per Munich Re estimates in the graph below. The average insured loss and ROL index since 1990 is $25 billion and 168 respectively. On the graph below I show the 15 year average for both which is $32 billion and 178 respectively. The current ROL pricing level is 18% and 23% below the average ROL since 1990 and the 15 year average respectively.
click to enlarge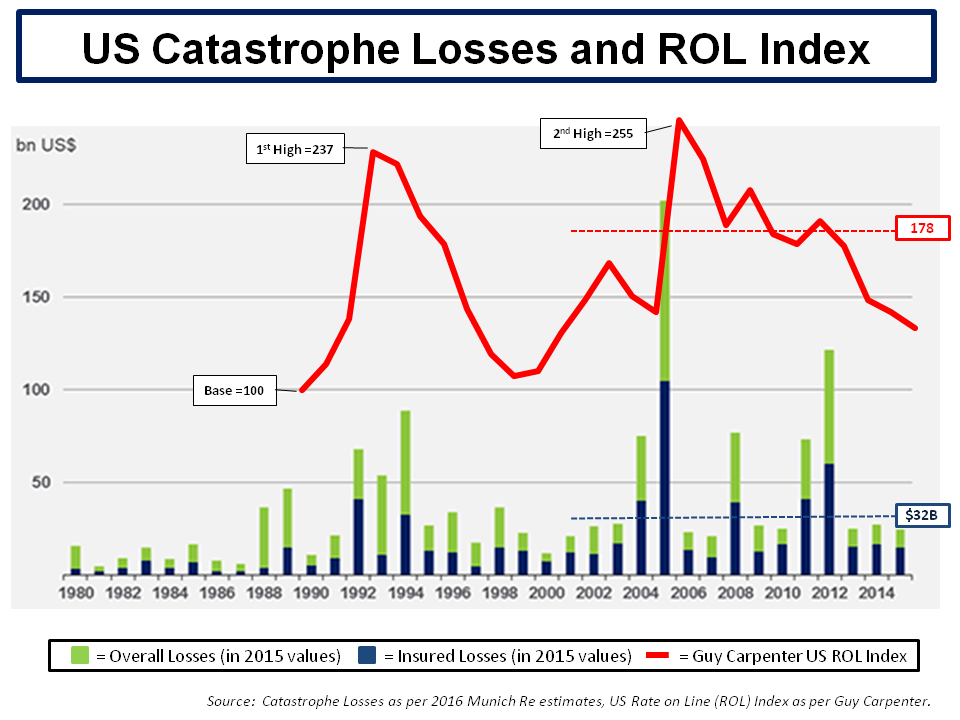
However, inflation adjusted insured losses are not exposure adjusted. Exposure adjusted losses are losses today which take into account today’s building stock and topology. To further illustrate the point, the graph in this 2014 post from Karen Clark shows exposure adjusted historical catastrophe losses above $10 billion. One of the vendor catastrophe modelling firms, AIR Worldwide, publishes its exposure adjusted annual average insured loss each year and its 2015 estimate for the US was $47 billion (using its medium timescale forecasts). That estimate is obviously some way off the 15 year average of $32 billion (which has been influenced by the recent run of low losses).
By way of answering the question posed, I have assumed (using nothing more than an educated guess) a base of an average annual insured loss level of $40 billion, being within an approximate inflation adjusted and exposure adjusted range of $35-45 billion, would imply a “technically correct” ROL level around 185. I guesstimated this level based upon the 10 year average settling at 195 for 4 years before the 2016 decline and applying a discount to 185 due to the lower cost of capital that ILS investors require. The former assumes that the market is an efficient means of price discovery for volatile risks and the latter is another way of saying that these ILS investors accept lower returns than professional insurers due to the magic which market wisdom bestows on the uncorrelated nature of catastrophic risk. 185 would put current US catastrophe premium at a 25% discount to the supposed “technical correct” level.
Some in the market say rates have bottomed out but, without any significant losses, rates will likely continue to drop. Kevin O’Donnell of RenRe recently said the following:
“We believe that a playbook relying on the old cycle is dead. The future will not see multi-region, multi-line hardening post-event. There’s too much capital interested in this risk and it can enter our business more quickly and with less friction. There will be cycles, but they will be more targeted and shorter and we have worked hard to make sure that we can attract the best capital, underwrite better, and deploy first when the market presents an opportunity.”
I cannot but help think that the capital markets are not fully appreciating the nuances of the underlying risks and simply treating catastrophe risks like other BB asset classes as the graph below illustrates.
click to enlarge
There is an alternate explanation. The factors impacting weather systems are incredibly complex. Sea surface temperatures (SSTs) and wind shear conditions are key variables in determining hurricane formation and characteristics. Elements which may come into play on these variables include the North Atlantic Oscillation (NAO) which is a fluctuation in pressure differences between the Icelandic and Azores regions, the Atlantic Multi-Decadal Oscillation (AMO) which measures the natural variability in sea surface temperature (and salinity) of the North Atlantic, and the El Niño Southern Oscillation (ENSO) which measures cyclical temperature anomalies in the Pacific Ocean off South America. Climate change is impacting each of these variables and it may be possible that US hurricanes will become less frequent (but likely more severe).
An article from late last year in the Nature Geoscience Journal from Klotzbach, Gray and Fogarty called “Active Atlantic hurricane era at its end?” suggests the active hurricane phase in the Atlantic could be entering a new quieter cycle of storm activity. The graph below is from their analysis.
click to enlarge
Could it be that the capital markets are so efficient that they have already factored in such theories with a 25% discount on risk premia? Yep, right.

My guess would be that the spread on ILS should be higher than anything BB rated – you’re dealing with a less liquid market and unlike corp bondholders who have recourse against a company that goes up belly up, you have no way of recouping your investment.
Thanks Margaret for your comment.
I agree that spreads are too low for the risk being taken. I have no idea how the rating agencies come up with their rating on catastrophe bonds. Take the Long Point Re III 2015-1 cat bond of $300 million from Travelers in May last year. Fitch rated it BB-. It has an initial attachment probability of 1.276%, an exhaustion probability of 0.946% and an expected loss of 1.106% base case, or 1.176% on a sensitivity case basis. It priced at 375 bps. Compared to corporate BB with historical defaults ranging from 0% to 4%, averaging around 75 bps I think and as you say there is the recovery rate to also consider.
Just doesn’t seem to compare!!!!
Keep up the comments.
M
Smells a bit like subprime, doesn’t it? I bet a time will come when you’ll be able to short cat bonds.
From my point of view (credit) getting paid 3 times expected loss looks like a decent deal. Since prices seem to be very low this implies that tails are definitly much thicker in cat space (or losses are more volatile).
Taking about BB corps, if you plug in 60% LGD (roughly the 20 or so year average in the US for senior unsecured debt) you get an EL of around 240bps… throw in a bit of volatility (read: unexpected loss) and your fair price is around 400bps, give or take.
Nice one. I will go through the links later, just a few quick thoughts.
I think your approximation gives a good idea. We can discuss all day long whether prices should be 25% higher or maybe 35% but I think we can agree that they seem to be veeeeery low.
Humans tend to suck in an environment that is not linear and not symetrically distributed (think normal distribution). Credit is such a beast and so is every kind of long-tail risk. Combine this with too much capital sloshing around and you might have the beginning of an explanation. Btw, this reminds me of some credit funds that made money 10 years in a row and went bust in the 11th year. Tail risk, anyone?
To add to Margaret’s point pricing should definitly be higher imho because of the higher volatility. Even more so if the thesis that (some) risks become less frequent but more severe. Which means you have a wider distribution of potential losses to digest which in turn requires a higher risk premium.
Thanks Eddie.
Check out page 2 of the Q4 report on portfolio returns from Lane financial here:
http://www.lanefinancialllc.com/content/blogcategory/0/44/
Returns don’t make much sense to me, even for a diverse portfolio!!!
M
I guess the difference between total return and insurance return is just LIBOR. If so insurance returns of around 6% don’t compare at all to what we currently have in HY space. As a rule of thumb 10y HY bonds should have a yield in the high single digits (9% or so). Right now it seems like things are upside down.
I have one nagging suspicion… Fitch was the most agressive rating agency in structured credit. Could it be the same this time, i.e. are their modelled losses (way) too low?