
Likely proving that a little knowledge is a dangerous thing, I was looking over the insurance tangible book value (TBV) multiples that I monitor and it stuck me that the S shaped curve from prospect theory may be more suitable than a linear fit. As I say, I am likely adding one and one and getting three!
The TBV multiples have continued to expand in 2013 as the graph below shows (market values as of the date shown against the tangible book value from the preceding quarter).
click to enlarge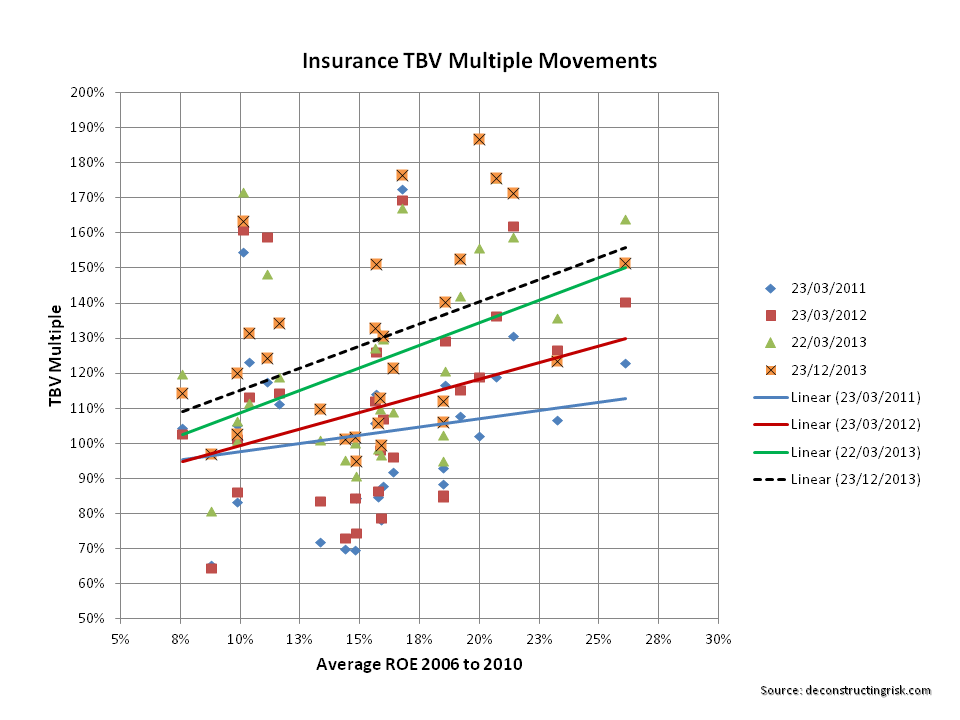
For the market values as of today against Q3 2013 tangible book value, I fitted a S curve as below.
click to enlarge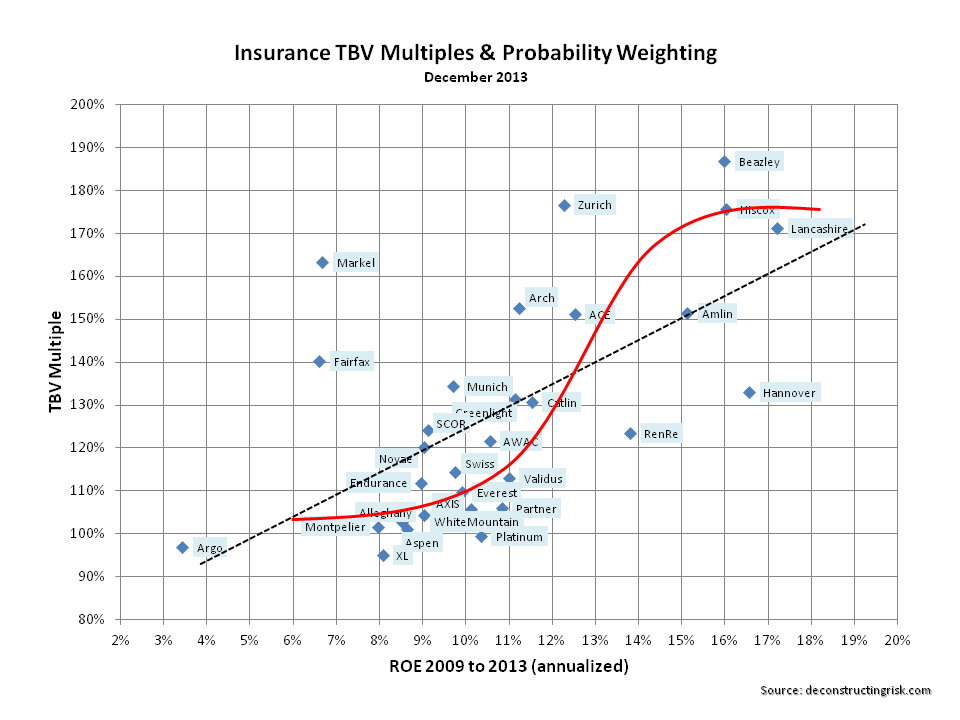
I am aware that the S curve is the wrong way around compared to one in the previous post but that could be rectified by flipping the axis. As I said, I haven’t really thought it through in detail but thought it was interesting all the same!
With that, I’d like to wish everybody a great Christmas and a peaceful 2014. Many thanks for your interest in my ramblings through 2013.
