Monthly Archives: January 2014

ILS Fund versus PropertyCat Reinsurer ROEs

Regular readers will know that I have queried how insurance-linked securities (ILS) funds, currently so popular with pensions funds, can produce a return on equity that is superior to that of a diversified property catastrophe reinsurer given that the reinsurer only has to hold a faction of its aggregate limit issued as risk based capital whereas all of the limits in ILS are collaterised. The recent FT article which contained some interesting commentary from John Seo of Fermat Capital Management got me thinking about this subject again. John Seo referred to the cost advantage of ILS funds and asserted that reinsurers staffed with overpaid executives “can grow again, but only after you lay off two out of three people”. He damned the traditional sector with “these guys have been so uncreative, they have been living off earthquake and hurricane risks that are not that hard to underwrite.

Now, far be it from me to defend the offshore chino loving reinsurance executives with a propensity for large salaries and low taxation. However, I still can’t see that the “excessive” overheads John Seo refers to could offset the capital advantage that a traditional property catastrophe reinsurer would have over ILS collateral requirements.

I understood the concept of ILS structures that provided blocks of capacity at higher layers, backed by high quality assets, which could (and did until recently) command a higher price than the traditional market. Purchasers of collaterised coverage could justify paying a premium over traditional coverage by way of large limits on offer and a lower counterparty credit risk (whilst lowering concentration risk to the market leading reinsurers). This made perfect sense to me and provided a complementary, yet different, product to that offered by traditional reinsurers. However, we are now in a situation whereby such collaterised reinsurance providers may be moving to compete directly with traditional coverage on price and attachment.

To satisfy my unease around the inconsistency in equity returns, I decided to do some simple testing. I set up a model of a reasonably diversified portfolio of 8 peak catastrophic risks (4 US and 4 international wind and quake peak perils). The portfolio broadly reflects the market and is split 60:40 US:International by exposure and 70:30 by premium. Using aggregate exceedance probability (EP) curves for each of the main 8 perils based off extrapolated industry losses as a percentage of limits offered across standard return periods, the model is set up to test differing risk premiums (i.e. ROL) for each of the 8 perils in the portfolio and their returns.  For the sake of simplicity, zero correlations were assumed between the 8 perils.

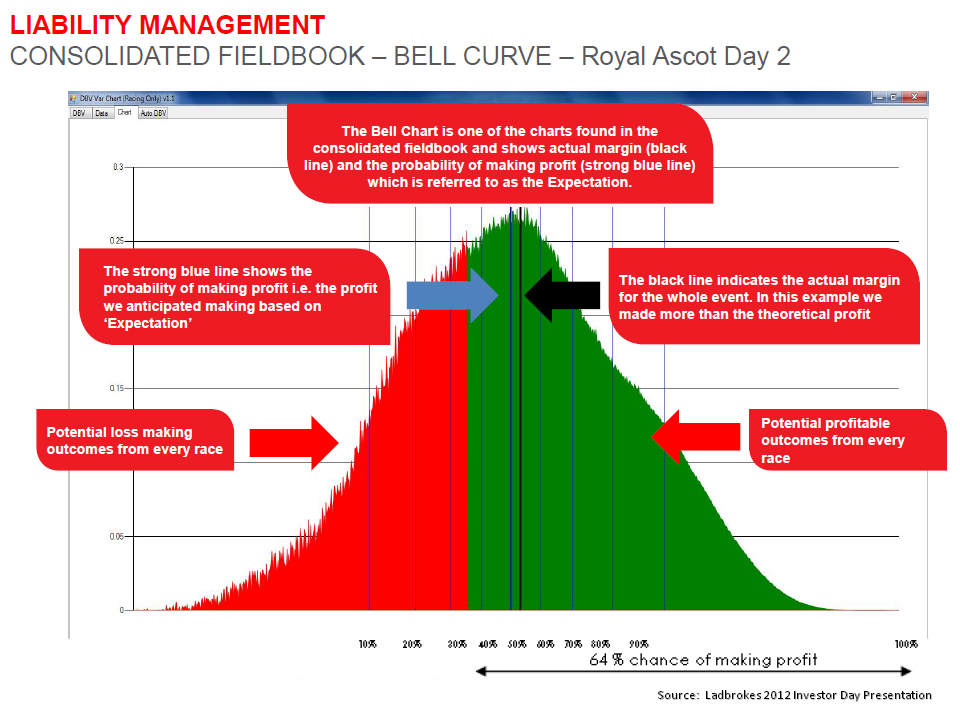
The first main assumption in the model is the level of risk based capital needed by the property catastrophe reinsurer to compete against the ILS fund. Reviewing some of the Bermudian property catastrophe players, equity (common & preferred) varies between 280% and 340% of risk premiums (net of retrocessions). Where debt is also included, ratios of up to 400% of net written premiums can be seen. However, the objective is to test different premium levels and therefore setting capital levels as a function of premiums distorts the results. As reinsurer’s capital levels are now commonly assessed on the basis of stressed economic scenarios (e.g. PMLs as % of capital), I did some modelling and concluded that a reasonable capital assumption for the reinsurer to be accepted is the level required at a 99.99th percentile or a 1 in 10,000 return period (the graph below shows the distribution assumed). As the graph below illustrates, this equates to a net combined ratio (net includes all expenses) of the reinsurer of approximately 450% for the average risk premium assumed in the base scenario (the combined ratio at the 99.99th level will change as the average portfolio risk premium changes).

click to enlargePropCAT Reinsurer Combined Ratio Distribution

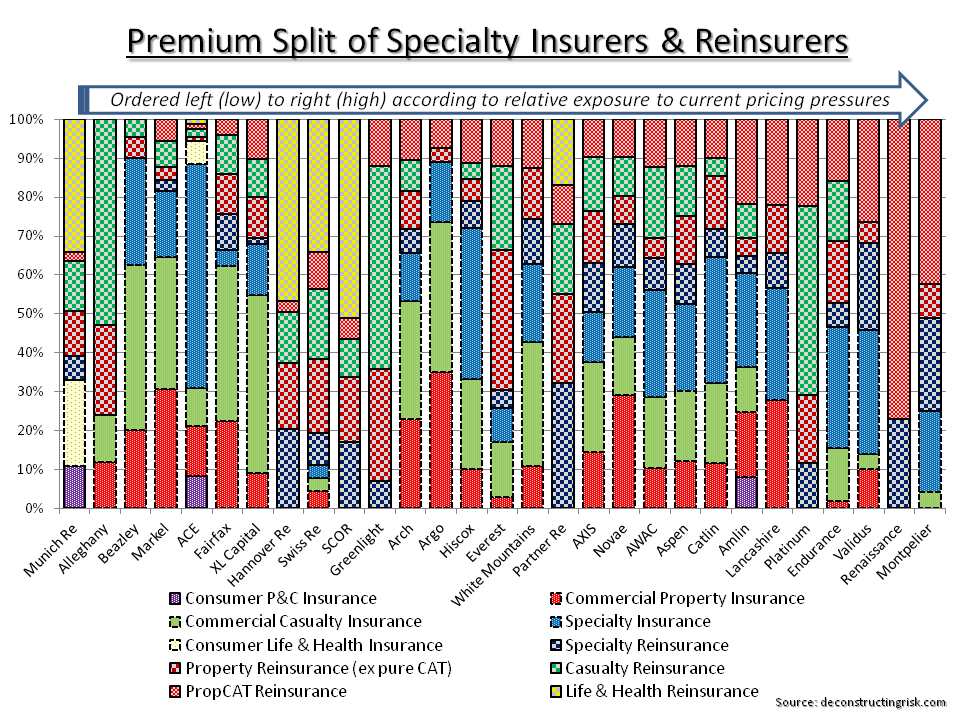
So with the limit profile of the portfolio is set to broadly match the market, risk premiums per peril were also set according to market rates such that the average risk premium from the portfolio was 700 bps in a base scenario (again broadly where I understand the property catastrophe market is currently at).

Reviewing some of the actual figures from property catastrophe reinsurer’s published accounts, the next important assumption is that the reinsurer’s costs are made up of 10% acquisition costs and 20% overhead (the overhead assumption is a bit above the actual rates seen by I am going high to reinforce Mr Seo’s point about greedy reinsurance executives!) thereby reducing risk premiums by 30%. For the ILS fund, the model assumes a combined acquisition and overhead cost of just 10% (this may also be too light as many ILS funds are now sourcing some of their business through brokers and many reinsurance fund managers share the greedy habits of the traditional market!).

The results below show the average simulated returns for a reinsurer and an ILS fund writing the same portfolio with the expense levels as detailed above (i.e 30% versus 10%), and with different capital levels (reinsurer at 99.99th percentile and the ILS fund with capital equal to the limits issued). It’s important to stress that the figures below do not included investment income so historical operating ROEs from property catastrophe reinsurers are not directly comparable.

click to enlargePropCAT Reinsurer & ILS Fund ROE Comparison

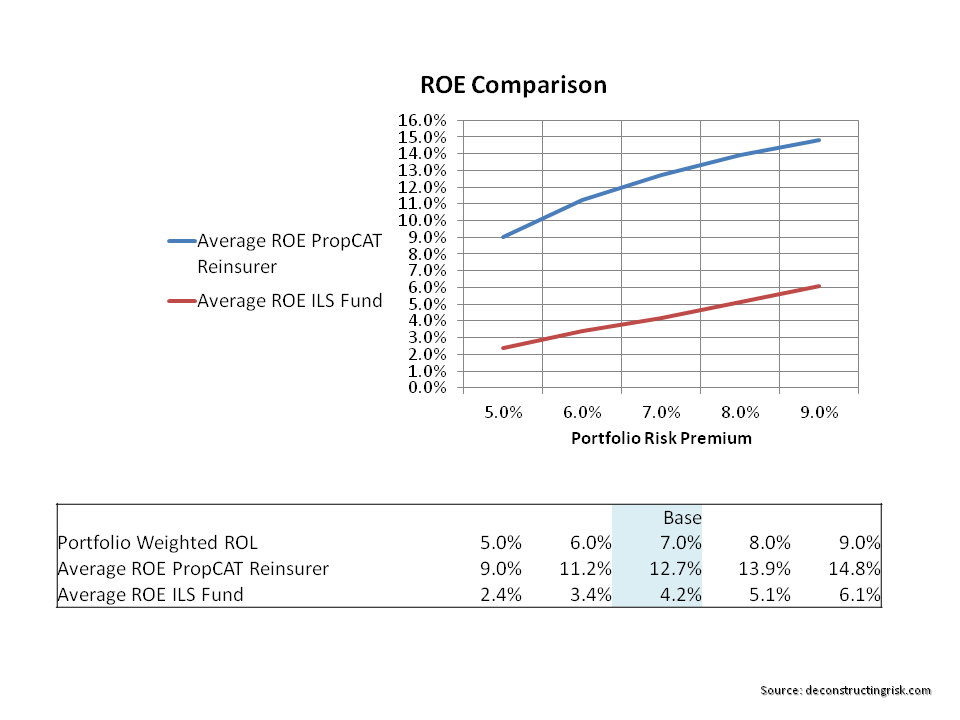
So, the conclusion of the analysis re-enforces my initial argument that the costs savings cannot compensate for the leveraged nature of a reinsurer’s business model compared to the ILS fully funded model. However, this is a simplistic comparison. Why would a purchaser not go with a fully funded ILS provider if the product on offer was exactly the same as that of a reinsurer? As outlined above, both risk providers serve different needs and, as yet, are not full on competitors (although this may be the direction of the changes underway in the market currently).

Also, many ILS funds likely do use some form of leverage in their business model whether by way of debt or retrocession facilities. And competition from the ILS market is making the traditional market look at its overhead and how it can become more cost efficient. So it is likely that both business models will adapt and converge (indeed, many reinsurers are now also ILS managers).

Notwithstanding these issues, I can’t help conclude that (for some reason) our pension funds are the losers here by preferring the lower returns of an ILS fund sold to them by investment bankers than the higher returns on offer from simply owning the equity of a reinsurer (admittedly without the same operational risk profile). Innovative or just cheap risk premia? Go figure.

COLT needs to show more progress

There has been an outburst of deal activity in European cable markets with Vodafone and Liberty Global squaring up on Spain’s Ono. Other European cable assets such as Com Hem, Get AS, and Galicia in Sweden, Norway and Spain respectively are reportingly also up for sale. Despite the economic woes in Europe and the regulatory uncertainty across the broader European telecom sector, valuations relative to the US have improved in 2013 returned to close to historical averages around 6 times EBITDA. The European incumbents are expected to see stabilisation, or at least a slowdown in decline, of revenue in 2014 and many are hoping that the environment is becoming more conducive to the long predicted European consolidation.

Against this background, I had a quick look over COLT Group SA, previously COLT Telecom, one of the start-up pan European telecoms from the heady days of the telecom bubble in the late 1990s/early 2000s. A previous post on the telecom sector touched on the past of COLT and the graph below shows the firm’s operating history to YE2012 and illustrates the pressure on cash-flow (e.g. EBITDA less capital expenditure) as a result of the changes COLT have undertaken since the mid-2000s to focus on being a pure pan-European data and managed services provider.

click to enlargeCOLT 2003 to 2012 Operating History

Digging a bit deeper, the breakdown of revenue by source shows that COLT has been making progress in reducing their exposure to lower margin voice revenues. However, annualising H1-2013 results shows that progress on EBITDA margins has slowed in the highly competitive sector and that returns on investment have yet to materialise operationally in a significant manner.

click to enlargeCOLT 2006 to H12013 Revenue Breakdown & EBITDA Margin

COLT is debt free but cash has reduced to €160 million as at Q3 (from €280m at YE 2012 & €340m at YE 2011) due to data centre infrastructure expense. COLT’s valuation, at below 5 times EBITDA, is less than many in the sector and also below recent acquisition multiples such as Deutsche Telecom’s purchase of GTS Central Europe for approx 6.3 times EBITDA. However, for me, recent sluggish revenue growth and EBITDA margins show that COLT still has much to prove in demonstrating the success of its investment in its strategy.

On the upside, a firm like COLT may get caught up in M&A speculation with someone like Vodafone looking to buy fixed line assets in Europe.

A look over some bookmakers’ books

I have been doing some digging into the dynamics of betting exchanges, the largest and best known of which is BetFair. The betting and gaming sector itself has been the subject of a mountain of academic research, there is even a journal dedicated to it! Quants have moved in and are actively pitting their algorithms against human gambling behaviour on the exchanges. A recent intriguing Bloomberg article on tennis betting illustrates some strategies now common in the marketplace.

Technology has driven disruptive disintermediation across many sectors such as the travel & airline industry and more recently across the retail sector. There was a fascinating documentary on the BBC by Robert Preston late last year on the UK retail sector which concluded that the future for many clothing retail outlets would be to act like galleries for consumers to peruse items with the ultimate purchase decision being made online.

The betting and gaming sector is one undergoing structural changes due to the massive increase in online activity. Additional competitive threats from disintermediated business models such as betting exchange pose interesting questions for the sector. Such structural market changes may be useful in understanding the impact of new business models in other sectors such as financial services –  peer to peer (P2P) lending in banking or the ILS market in insurance come to mind. On the growing P2P lending sector, there was an article on the front page of Friday’s FT on how a UK developer sourced £4 million of debt through online P2P platform Lendinvest which may prove to be defining moment of change. On the impact of the ILS market, there was another interesting FT article that contended that the ILS market is resulting in structural changes in a market with “a lot of excessive overhead, ie highly paid staff, that can be eliminated”.

Before looking deeper into structural changes in the betting and gaming sector, I needed to understand the “traditional” betting market better. Besides the odd poker tournament (with real people), I am not a gambler and therefore not a user of the services provided by betting firms. I know enough that the odds are obviously in the bookies favour but I know very little about the economics of the betting industry. As such, this post details my research on the UK betting industry. A follow on post will go into the broader picture and some (likely rambling) thoughts on the impact of structural changes from betting exchanges like Betfair.

So, I concentrated on the UK market where data is freely available. The graphic below outlines the size of the UK betting and gaming market with the main providers. The market is split by revenue approx 60% retail and 40% online. The retail market is split approx 50:50 between over the counter betting at shops and gaming on machines (aka fixed odds betting terminals or FOBTs). On the online side, sports betting (commonly referred to as the Sportsbook) is approx 40% with gaming making up the remainder, led by casino (approx 30%), poker and bingo (approx 15% each).

click to enlargeUK Gambling Market Size

The main players on the retail side stress the advantages of their multi-access models and, to counter the impression that retail betting shops attach the older demographic, cite statistics that show even younger customers often use retail outlets (more and more in combination with online and mobile).

The gaming machine/FOBT sector has come under renewed focus recently. Derek Webb, a successful gambler, is one of the principles behind the Campaign for Fairer Gambling and has described the machines as “crack cocaine”. Campaigners point to the rapid rise in revenue from FOBT, which were only widely introduced in the early 2000s, the addictive nature of the machines and that users are high frequency gamblers with a concentration amongst younger men with low incomes. Bookies point to the high payouts (the margin taken by the bookmaker is generally about 3% to 4% of the amount staked whereby such margin is referred to as the gross win) and the importance of machines supporting the retail shop model (I estimate that FOBT can contribute 70% to 80% of retail operating profits). Political pressure is mounting to restrict the amount that can be bet on the machines and JP Morgan recently cut its rating on Ladbrokes and William Hill saying that the likely change “could make the bottom 20pc of Ladbrokes and William Hill shops loss-making, with a further 20pc only marginally profitable, and require significant restructuring to close shops in order to cut costs.

I selected Ladbrokes, William Hill and Paddy Power as firms to do some deeper analysis. William Hill and Ladbrokes are long established firms, particularly in the retail sector. William Hill is also the market leader in the online sector with a particular strength in online casino gaming. Paddy Power is the new kid on the block growing aggressively in online, particularly over the past 5 years, from its Irish base into the fourth largest in the online sector. Size wise, William Hill and Ladbrokes had revenue of £1.3 billion and £1 billion in 2012 respectively while Paddy Power had 2012 revenue of €650 million (approx £570 million). It would have been interesting to have a deeper look at the online only Bet365, which was founded in 2000 by Denise Coates and is now the number 2 in the UK online market with over £200 million in revenue, but unfortunately Bet365 is private. The graph below shows the share price moves of the selected firms since 2009.

click to enlargeShare Price William Hill Ladbrokes Paddy Power

The graph below shows the profit before tax margins of the firms since 2003. As can be seen, profit margins have been under pressure, particularly for Ladbrokes in recent years.

click to enlargePBT % William Hill Ladbrokes Paddy Power

Revenue and operating profit breakdown for William Hill is below.

click to enlargeWilliam Hill Revenue & Operating Profit Breakdown

Revenue and operating profit breakdown for Ladbrokes is below.

click to enlargeLadbrokes Revenue & Operating Profit Breakdown

Revenue and operating profit breakdown for Paddy Power is below.

click to enlargePaddy Power Revenue & Operating Profit Breakdown

As mentioned above, the percentage that a bookmaker takes as a margin in each business is called the gross win (another commonly used term is the overround which refers to the excess above the sum of the odds). Net revenues are gross wins less VAT and fair-value adjustments for free bets, promotions and bonuses. Care needs to be taken when comparing gross win percentages (i.e. gross win divided by amounts staked) across firms as the make-up of the underlying books is important (gross wins varies by sport type such as football, horses, tennis, etc and by geography). Also items such as betting levies and charges vary and some are not deducted in the gross win to net revenue calculations but rather in operating expenses. Items such as the new UK point of consumption (POC) tax that is due to be introduced later this year also need to be understood in their potential accounting treatment. The graph below compares the reported gross win percentages amongst the firms in the retail over the counter (OTC) business and in the online Sportsbook businesses for the firms.

click to enlargeGross Win Percentage

I have found it difficult to get metrics for the profitability of both the retail and the online gaming businesses. As discussed above on the FOBT business, the operating profit contribution from gaming can be significant. I suspect that online gaming also contributes significantly to the online operating profit although not as high as the 70% to 80% contribution that I estimated for the retail business

Online gaming is also a more cross border business and is the fastest growing segment of the gambling industry. H2 Gambling Capital, a leading supplier of data and market intelligence on the global gambling industry, puts the size of the global online gaming market at approx $30 billion. Large markets such as the US are seen as ultimately providing a massive opportunity for growth once regulatory issues are resolved. Although firms withdrew from the US in 2006 after the passing of the Unlawful Internet Gambling Enforcement Act (UIGEA), individual States such as Nevada and New Jersey are looking at ways that they can approve online gaming and challenge federal restrictions.

Although the established firms like William Hill and Ladbrokes are facing headwinds in their business with significant competition from online upstarts like Paddy Power, Bet365 and Betfair, they have size and powerful brands on their side. Both have made significant investments in IT infrastructure to support their business. The area of liability management is one that is particularly interesting. Ladbrokes, for example, has made significant investment in enhancing their trading abilities through the development of Morse, their own algorithmic robot. They cite the use of Morse in improving pricing which is particular important in the growing bet in play (BIP) market, as the exhibit shows.

click to enlargeLadbrokes Pricing & Trading Exhibit 2012 Investor Day

They also cite the use of such active liability management tools in improving outcomes such as the Royal Ascot results below.

click to enlargeLadbrokes Liability Management Exhibit 2012 Investor Day

Changes in the whole betting and gaming sector have been rapidly evolving over recent years. These changes and the impact of betting exchanges will be the subject of a follow on post with some further musings in the coming weeks.

Another look across insurance cycles

Following on from a previous post on insurance cycles and other recent posts, I have been looking over the inter-relationship between insurance cycles in the US P&C market, the Lloyds of London market and the reinsurance market. Ideally, the comparisons should be done on an accident year basis (calendar year less prior year reserve movements) with catastrophic/large losses for 2001/2005/2011 excluded but I don’t (yet) have sufficient historical data to make such meaningful comparisons.

The first graph shows calendar year combined ratios in each of the three markets. The US P&C figures contain both consumer and commercial business and as a result are less volatile with the other markets. For example, Lloyds results are from specialty business classes like energy, marine, credit & surety, A&H, specialty casualty, excess and surplus (E&S) lines and reinsurance. The reinsurance ratios are those for most reinsurers as per S&P in their annual global reports. For good measure, I have also included the US real interest rates to show the impact that reduced investment income is having on the trend in combined ratios across all markets. Overall, ratios have been on a downward trend since the early 1990s. However, if catastrophic losses and reserve releases are excluded ratios have been on an upward trend since 2006 across Lloyds and the reinsurance markets. Recent rate increases in the US such as the high single digit rate increases in commercial property & workers comp (see Aon Benfield January report for details on US primary rate trends) may mean that the US P&C market comes in with a combined ratio below 100% for the full 2013 year (from 102% and 106% in 2012 and 2011 respectively).

click to enlargeInsurance Cycle Combined RatiosAs commented on above, the US P&C ratios cover consumer and commercial exposures and don’t fully show the inter-relationship between the different business classes across that market. The graph below shows the calendar year ratios in the US across the main business classes and paint a more volatile picture than the red line above.

click to enlargeUS Commercial Business Classes Combined Ratios

An Unhappy New Year for Reinsurers?

The broker reports on the January renewals paint a picture of building pricing pressures for reinsurers and specialty insurers. The on-going disintermediation in the property catastrophe market by new capital market capacity is causing pricing pressures to spill over into other classes, specifically on other non-proportional risks and on ceding commissions on proportional business.

The Guy Carpenter report  highlight that traditional players are fighting back on terms and conditions through “an extension of hours clauses, improved reinstatement provisions and expanded coverage for terror exposures” and “many reinsurers offered more tailored coverage utilizing options such as aggregate and quota share cover, multi-year arrangements and early signing opportunities at reduced pricing”. Guy Carpenter also point to large buyers looking at focusing “their programs on a smaller group of key counter-party relationships that were meaningful in relation to the overall size of the program”.

The Aon Benfield report and the Willis Re report also highlight the softening of terms and conditions to counteract cheap ILS capacity emphasising items such as changes in reinstatement terms.  Willis states that “the impact of overcapacity has been most clearly evidenced by the up to 25% risk adjusted rate reductions seen on U.S. Property Catastrophe renewals at 1 January and the more modest but still significant rate reductions of up to 15% on International Property Catastrophe renewals”.

Following an increase in valuation multiples from all time lows for the sector over the past 24 months, the current headwinds for the sector as a result of over-supply and reduced demand mean, in my opinion, that now is a good time for investors to reduce all exposure to the sector and move to the side-lines. I particularly agree with a comment in the Willis report that “experienced reinsurers will remember that the relaxation of terms and conditions more so than price reduction caused the real damage in the last soft market cycle”. Meaningful upside from here just doesn’t look on the cards to me particularly when compared to the downside risks (even M&A activity is likely to be with limited premium and/or on an all stock basis).

The graph below shows the premium split by main product line for the firms that I monitor. The firms have been sorted left to right (low to high exposure) by a subjective factor based upon exposure to the current pricing pressures. The factor was calculated using a combination of a market pricing reduction factor for each of the main business classes based upon the pricing indicated in the broker reports and upon individual business class discounts for each firm depending upon their geographical diversification and the stickiness of the business written. The analysis is fairly subjective and as many of the firms classify business classes differently the graph should be considered cautiously with a pinch of salt.

click to enlargePremium Split Specialty Insurers & Reinsurers

Unsurprisingly, reinsurers with a property catastrophe focus and with limited business class diversification look the most exposed. The impact of the reduced pricing on accident year ratios need to be combined with potential movement in reserves to get the impact on calendar year operating results. Unfortunately, I don’t have the time at the moment to do such an analysis on a firm by firm basis so the graph below simply compares the subjective pricing factor that I calculated against average operation ROEs from 2009 to Q3 2013.

click to enlargeSpecialty Insurers & Reinsurers Exposure to Pricing Pressures

As stated previously, the whole sector is one I would avoid completely at the moment but the graph above suggests that those firms on the right, specifically those in the lower right hand quadrant, are particularly exposed to the on-going pricing pressures.