
I haven’t had time to go into the latest WGIII IPCC report in detail (indeed I haven’t had much time recently to spend on blogging) but I had a quick browse through the report and there is an excellent chapter on “Integrated Risk and Uncertainty Assessment of Climate Change Response Policies” which goes through many of the key elements of current risk management theory and practise and how they can be applied to climate change.
A previous post highlighted the difficulties of making predictions given the uncertainties involved. The report highlights the “large number of uncertainties in scientific understanding of the physical sensitivity of the climate to the build‐up of GHGs” and acknowledges that these “physical uncertainties are multiplied by the many socioeconomic uncertainties that affect how societies would respond to emission control policies”. The report calls these socioeconomic uncertainties “profound” and lists examples as the development and deployment of technologies, prices for major primary energy sources, average rates of economic growth and the distribution of benefits and costs within societies, emission patterns, and a wide array of institutional factors such as whether and how countries cooperate effectively at the international level.
The IPCC gives a medium rating (50% probability) to the statement that the “current trajectory of global annual and cumulative emissions of GHGs is inconsistent with widely discussed goals of limiting global warming at 1.5 to 2 degrees Celsius above the preindustrial level”.
Included in Chapter 2 are the graphs below. According to the report “the representative concentration pathways (RCPs) are constructed by the IPCC on the bases of plausible storylines while insuring (1) they are based on a representative set of peer reviewed scientific publications by independent groups, (2) they provide climate and atmospheric models as inputs, (3) they are harmonized to agree on a common base year, and (4) they extend to the year 2100”. The 3 scenarios (A2, A1B and B1) are multi-model global averages of surface warming (relative to 1980–1999) shown as continuations of the 20th century simulations. Shading is the plus/minus one standard deviation range of individual model annual averages and the orange line is where concentrations were held constant at year 2000 values. Time permitting; it demonstrates that the conclusions and scenarios presented in the latest report are worth finding out more about.
click to enlarge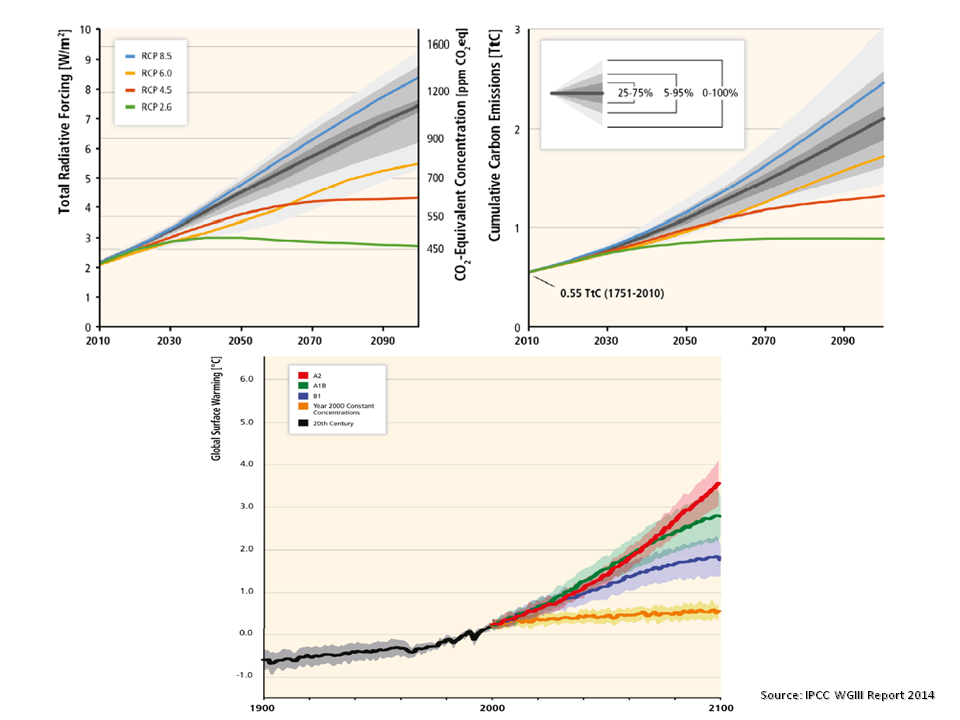
Although each scenario is likely at the mercy of the uncertainties highlighted above, the open and thoughtful way the report is presented, including highlighting the underlying weaknesses, doesn’t mean that they (or the report) can be ignored. Indeed, the recent output from the IPCC will hopefully provide the basis for informed thinking on the subject in the coming years.
The report includes a reference to Kahneman-Tversky’s certainty effect where people overweight outcomes they consider certain, relative to outcomes that are merely probable. That implies that a 50% probability of the temperature blowing through 2 degrees celsius may not be enough to force real action. Unfortunately the underlying scientific and socioeconomic uncertainties inherent in making forecasts on temperature change over the next 30 to 50 years may mean that the required level of certainty cannot ever be achieved (until of course it’s too late).
