Monthly Archives: March 2014

Smart money heading for the exits?

Private equity is rushing to the exits in London with such sterling businesses as Poundland and Pets at Home coming to the market. PE has exited insurance investments, following the successful DirectLine float, for names like Esure, Just Retirement, and Partnership. It was therefore interesting to see Apollo and CVC refloat 25% of BRIT Insurance last week after taking them off the market just 3 short years ago.

The private equity guys made out pretty good. They bought BRIT in 2011 for £890 million, restructured the business & sold the UK retail business and other renewal rights, took £550 million of dividends, and have now floating 25% of the business at a value of £960 million. To give them their due, they are now committing to a 6 month lock-up and BRIT have indicated a shareholder friendly dividend of £75 million plus a special dividend if results in 2014 are good.

I don’t really know BRIT that well since they have been given the once over by Apollo/CVC. Their portfolio looks like fairly standard Lloyds of London business. Although they highlight that they lead 50% of their business, I suspect that BRIT will come under pressure as the trend towards the bigger established London insurers continues. Below is a graph of the tangible book value multiples, based off today’s price, against the average three year calendar year combined ratio.

click to enlargeLondon Specialty Insurers NTA multiples March 2014

Munich’s Underwriting Cycle

Munich Re had a good set of results last week with a 12.5% return on equity on a profit of €3.3 billion (with the reinsurance business contributing €2.8 billion of the profit). A €1 billion share buyback was also announced contributing to the ongoing shareholder friendly actions by industry players. Munich is targeting €3 billion for 2014 but warned of challenges ahead including “the lingering low-interest-rate environment, increasing competition in reinsurance, and changes in demand from clients in primary insurance”.

Torsten Jeworrek, Munich Re’s Reinsurance CEO, cited tailor-made solutions as a strength for Munich highlighting “multi-year treaties (occasionally incorporating cross-line and cross-regional covers), retroactive reinsurance solutions, transactions for capital relief, comprehensive consultation on capital management, and the insurance of complex liability, credit and large industrial risks”.

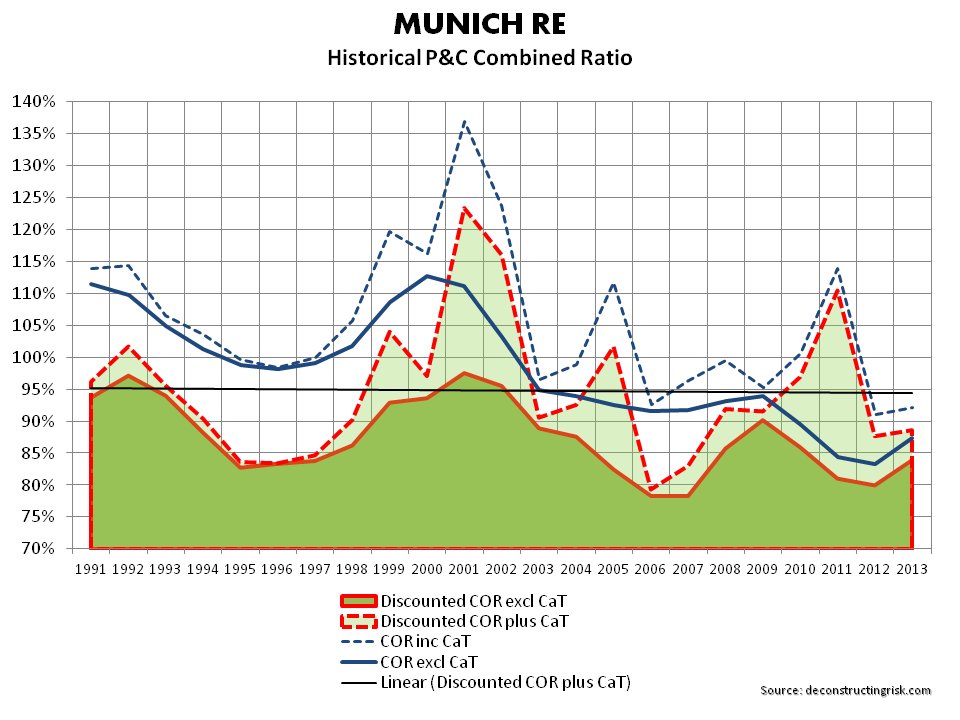
Whilst looking through the 2013 report, I noticed historical calendar year combined ratios (COR) for the P&C business (reinsurance & primary) including and excluding catastrophes. I dug up these figures going back to 1991 as per the graph below. A small amount of adjustment was needed, particularly in relation to the 24.3% and 17.1% of deterioration for 2001 and 2002 relating to 9/11 losses (which I included as catastrophes in the CaT ratio for those years). As with a previous post on underwriting cycles, I then “normalised” the COR excluding catastrophes for the changes in interest rates using a crude discount measure based upon the US risk free rate for each calendar year plus 150 bps over 2.5 years. That may be conservative, particularly for the 1990s where equities were a bigger part of European’s asset portfolio. I then added the (undiscounted) CaT ratio to the discounted figures to give an idea of the historical underwriting cycle.

click to enlargeMunich Underwriting Cycle

The “normalised” average discounted COR (excluding CaT) since 1991 is 87% and the average over the past 10 years is 83%. The standard deviation for the series since 1991 is 6% and for the last 10 years 4% indicating a less volatile period in recent years in core ratios excluding catastrophes.

The average CaT ratio since 1991 is 7% versus 9% over the past 10 years. The standard deviation for the CaT ratio since 1991 is 8% and for the last 10 years 9% indicating a more volatile period in recent years in CaT ratios.

Adding the discounted CORs and the (undiscounted) CaT ratios, the average since 1991 and over the past 10 years is 95% and 92% respectively (with standard deviation of 11% and 9% respectively).

As Munich is the largest global reinsurer, the ratios (reinsurance & primary split approx 80%:20%) above represent a reasonable cross section of industry and give an average operating return of 5% to 8% depending upon the time period selected. Assuming a 0.5% risk free return today, that translates into a rough risk adjusted return as per the Sharpe ratio of 0.44 and 0.80 for the period to 1991 and over the past 10 years respectively. Although the analysis is crude and only considers operating results, these figures are not exactly earth-shattering (even if you think the future will be more like the last 10 years rather than the longer term averages!).

Such results perhaps explain the growing trend of hedge funds using reinsurance vehicles as “float” generators. If the return on assets over risk free is increased from the 150 bps assumed to 300 bps in the analysis above, the Sharpe ratios increase to more acceptable 0.73 and 1.13 respectively. And that ignores the tax benefits amongst other items!

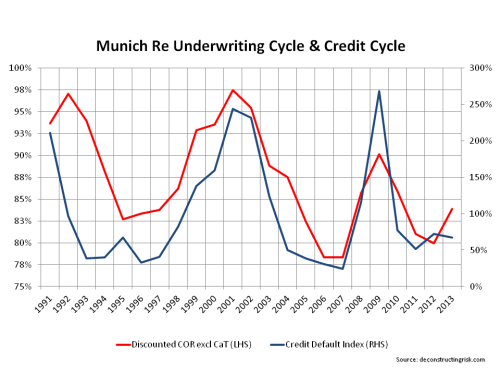
As an aside, I again (as per this post) compared the underlying discounted COR (excluding catastrophes) from Munich against a credit index of global corporate defaults (by originating year as a percentage of the 1991 to 2013 average) in the graph below. As a proxy for the economic & business cycles, it illustrates an obvious connection.

click to enlargeMunich Underwriting & Credit Cycle

Bookies’ Year-End Numbers and Budget Woes

This was an interesting week for certain sectors given the UK budget. Annuity insurers were stunned by the scraping of the requirement to purchase annuities upon retirement, thereby denying the sector of a statutory ability to rip off customers. Hopefully, the move will result in innovation in the insurance and fund sectors in providing customers with retirement products of genuine value by way of low cost index following returns with elements of longevity protection.

The other sector which got hit was the bookmakers with an increase in taxes on gaming machines (aka fixed odds betting terminals or FOBTs) to 25% from 20% and an extension of the horse racing betting levies to include offshore operators. A previous post on the betting sector outlined some of the dynamics at play (I still have to follow that up with a post on betting exchanges, specifically Betfair). The FOBT tax increases apply to both category B2 machines (casino games) and B3 machines (slot games). The timing of the tax increase caused surprise as the UK Department for Culture Media and Sport are looking into how the FOBT can be restricted to reduce its appeal to younger men with low incomes and gambling problems.

Shares of UK bookmakers took a hit from the news, particularly Ladbrokes as the UK bookmaker most dependent upon FOBTs. The graph below shows the impact.

click to enlargeShare Price 2012 to March2014 William Hill Ladbrokes Paddy Power

The reason for Paddy Power’s performance over Ladbrokes and William Hill is explained by their relative low exposure to gaming machines as the exhibit below shows (which updates revenue and operating profit breakdowns for the three firms).

click to enlargeBookie's books YE2013

Analysts estimate that the FOBT tax increase could impact the profits of Ladbrokes and William Hill by £20 million and £16 million respectively (compared to 2013 net income of £67 million and £226 million respectively).

The budget increases are on top of the introduction of the online point of consumption (POC) tax of 15% due in the UK from December. The impact of this tax upon the online operations of bookies (and indeed upon Betfair) is unknown and something I will hopefully return to in the future. In its 2013 annual report, William Hill offered the following:

Taken together, the competitiveness of our digital offering and our healthy financial position leave us well positioned to tackle both opportunities and challenges created by the posited introduction of a Point of Consumption tax on UK online gambling in December 2014 which we believe is likely to result in a dislocation of the UK online gambling market given its likely impact on industry operating profit margins. While it will lead to a significant additional cost for the Group – of a size we consider impossible to mitigate in full in the short term – we do believe there is potential for larger scale operators to benefit from increased market share as smaller operators may be squeezed out of the market by the additional tax burden.

As can be seen from the above graphs, Ladbrokes looks like a business under real pressure. Its brand is strong but its business is far too reliant upon UK retail and gaming machines in particular. Many analysts favour William Hill due to its balance between retail & online and between sports & gaming.  Paddy Power’s 500% share price rise over the past 5 years has been muted in the past year due to industry headwinds and how they manoeuvre the POC issue will be fascinating (as it will be for other pure online bookies and the betting exchange BetFair).

AIG still below $50: an explanation

In a previous post on AIG I tried to unpick each of the main drivers of the business and predict a “normalised” net income for 2014. Well, my estimate of $7.25 billion of net income for 2013 was blown out of the water by over $4 billion for H2 bringing the 2013 total to $9 billion. This is a massive increase on the $3.4 billion from 2012. A follow-on post in October outlined how I was surprised by a $1 billion tax benefit in Q3.

At $49, the stock currently trades at a discount of 71% to book value (incl AOCI) and 76% to book value (excl AOCI). Given the 2013 results and the successful sale of the aircraft leasing business, why is AIG not trading well above $50? Well, one reason may be that outlined in the graphic below.

click to enlargeAIG Net Income 2013 10K vrs 2012 10K

After the amount of change that AIG has gone through, reinstatements were to be expected. However, you should expect AIGs’ numbers to have stabilized by now and to be more consistent than movements of between $1.6, $0.6 & $1 billion for 2009, 2010, and 2011 as reported between the 2012 and 2013 10Ks. And a staggering $6.4 billion for 2012! How can that be? To be honest, my desire to dig deeper and find an explanation evaporated by the simple fact that it should not happen and my conviction in AIG has dropped commensurate with by disbelief.

If you believe that the movements are for rational reasons and can be taken into account in future estimates, then good luck to you. The exhibits below represents what the latest 10K figures show.

The breakdown of “normalised” pre-tax income below (excluding items from AIA, ML III, aircraft leasing & debt restructures) shows consistent contributions from the “hodge-podge” of the mortgage business, GCM and DIB (combined up to $2.4 billion in 2013 from $2.2 billion in 2012). The P&C contribution is up considerably from 2011 & 2012 around $2 billion to over $5 billion. Life & retirement is also up to $6.5 billion in 2013 from under $4 billion in 2012 and approx $3 billion in 2011

click to enlargeAIG PreTax income 2001 to 2013

The P&C improvement in pre-tax income is primarily due to improvements in the US commercial & other business lines. The US commercial business benefited from a light 2013 catastrophe year whilst the other business segment had a lower underwriting loss and high investment income. The expense ratio, particularly in the international segment, remains high.

click to enlargeAIG Inc - P&C PreTax income 2001 to 2013

Life & retirement benefited from good top-line growth, a $1 billion legal settlement, and $2 billion of realized capital gains.

After taking the 2013 trends into account and taking out some 2013 one-offs and including an average US catastrophe year, my previous estimate of a “normalised” $6.5 billion of net income for 2014 and a $60-$70 price target over 12-18 months does not seem unreasonable. That’s if you have confidence in the reported 2013 figures. Which, based upon the first exhibit above, I don’t.

ILS price check: 20% more for 20% less

Guy Carpenter issued an update today on the Cat Bond market stating that the “influence from direct capital market participation in reinsurance programs, coupled with catastrophic insured losses well below historical averages in 2013, put significant pressure on global catastrophic reinsurance pricing”. They also made the point that “spreads have tightened between indemnity and other trigger types, sponsors were inclined to take advantage of investors’ openness to indemnity triggers to reduce coverage basis risk without a material increase in pricing relative to non-indemnity trigger pricing”.

The always interesting Global Property Catastrophe ROL index showed an 11% fall at January 2014.

I find it informative to compare current pricing to the past and the latest deal from Chubb covering US wind and quake risk from the NorthEast is hot off the press. East Lane Re VI increased in size to $270 million due to demand and got pricing at the bottom of the (already revised) pricing range at 275 bps. Thus the “20% more for 20% less” of the title of this post. The deal attaches in excess of $3 billion, above any historical storms (the largest of which is the 1938 New York storm at $2.9 billion), with a modelled 0.87% attachment and 0.77% exhaustion probability.

Although I am not sure if all of the conditions are exactly the same, it looks like Chubb got a good deal (for 4 years) compared to Class A of the East Lane IV Ltd, their expiring 2011 deal, which also covered US wind and quake risk in the NorthEast in excess of $3 billion. That one paid a 575 bps coupon, a whole 300 bps above the pricing they got this month!