Category Archives: Insurance Market

An Unhappy New Year for Reinsurers?

The broker reports on the January renewals paint a picture of building pricing pressures for reinsurers and specialty insurers. The on-going disintermediation in the property catastrophe market by new capital market capacity is causing pricing pressures to spill over into other classes, specifically on other non-proportional risks and on ceding commissions on proportional business.

The Guy Carpenter report  highlight that traditional players are fighting back on terms and conditions through “an extension of hours clauses, improved reinstatement provisions and expanded coverage for terror exposures” and “many reinsurers offered more tailored coverage utilizing options such as aggregate and quota share cover, multi-year arrangements and early signing opportunities at reduced pricing”. Guy Carpenter also point to large buyers looking at focusing “their programs on a smaller group of key counter-party relationships that were meaningful in relation to the overall size of the program”.

The Aon Benfield report and the Willis Re report also highlight the softening of terms and conditions to counteract cheap ILS capacity emphasising items such as changes in reinstatement terms.  Willis states that “the impact of overcapacity has been most clearly evidenced by the up to 25% risk adjusted rate reductions seen on U.S. Property Catastrophe renewals at 1 January and the more modest but still significant rate reductions of up to 15% on International Property Catastrophe renewals”.

Following an increase in valuation multiples from all time lows for the sector over the past 24 months, the current headwinds for the sector as a result of over-supply and reduced demand mean, in my opinion, that now is a good time for investors to reduce all exposure to the sector and move to the side-lines. I particularly agree with a comment in the Willis report that “experienced reinsurers will remember that the relaxation of terms and conditions more so than price reduction caused the real damage in the last soft market cycle”. Meaningful upside from here just doesn’t look on the cards to me particularly when compared to the downside risks (even M&A activity is likely to be with limited premium and/or on an all stock basis).

The graph below shows the premium split by main product line for the firms that I monitor. The firms have been sorted left to right (low to high exposure) by a subjective factor based upon exposure to the current pricing pressures. The factor was calculated using a combination of a market pricing reduction factor for each of the main business classes based upon the pricing indicated in the broker reports and upon individual business class discounts for each firm depending upon their geographical diversification and the stickiness of the business written. The analysis is fairly subjective and as many of the firms classify business classes differently the graph should be considered cautiously with a pinch of salt.

click to enlargePremium Split Specialty Insurers & Reinsurers

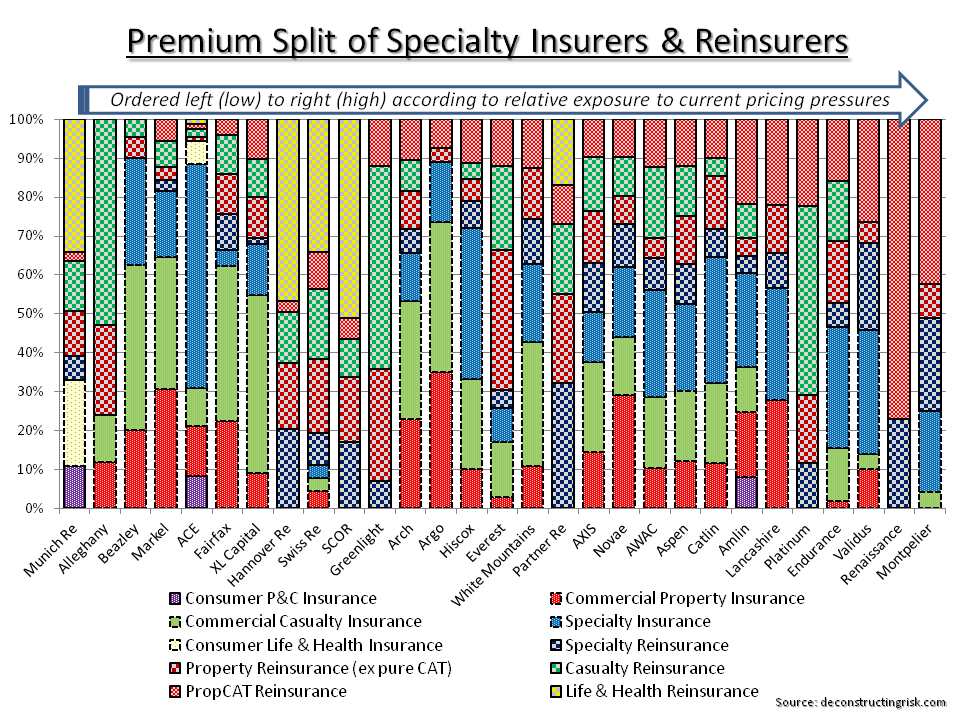
Unsurprisingly, reinsurers with a property catastrophe focus and with limited business class diversification look the most exposed. The impact of the reduced pricing on accident year ratios need to be combined with potential movement in reserves to get the impact on calendar year operating results. Unfortunately, I don’t have the time at the moment to do such an analysis on a firm by firm basis so the graph below simply compares the subjective pricing factor that I calculated against average operation ROEs from 2009 to Q3 2013.

click to enlargeSpecialty Insurers & Reinsurers Exposure to Pricing Pressures

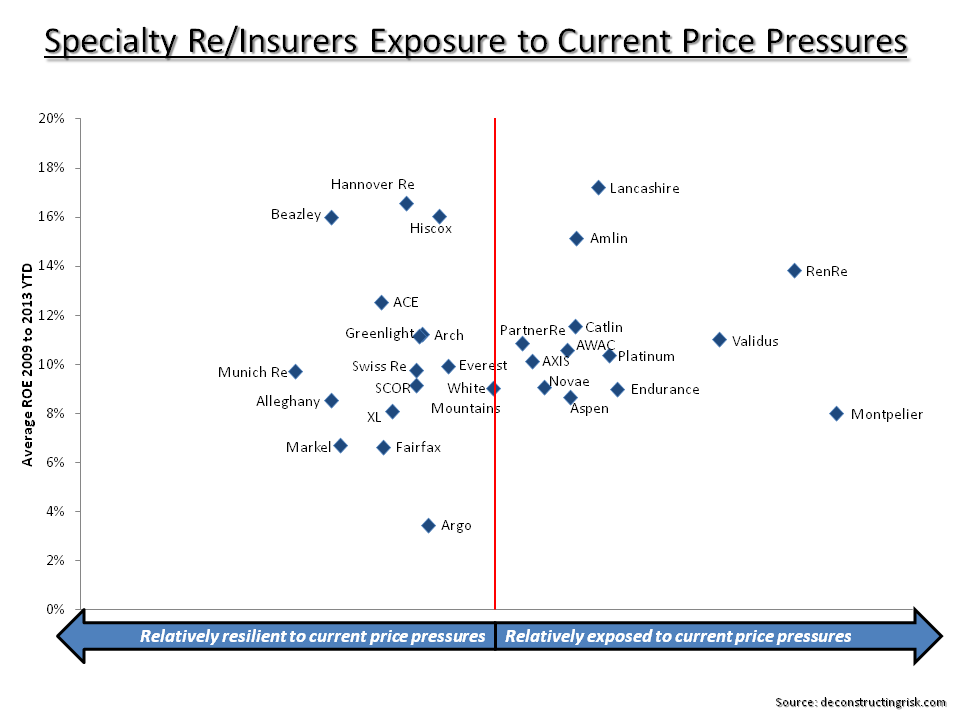
As stated previously, the whole sector is one I would avoid completely at the moment but the graph above suggests that those firms on the right, specifically those in the lower right hand quadrant, are particularly exposed to the on-going pricing pressures.

Insurance TBV Multiples & Probability Weighting

Likely proving that a little knowledge is a dangerous thing, I was looking over the insurance tangible book value (TBV) multiples that I monitor and it stuck me that the S shaped curve from prospect theory may be more suitable than a linear fit. As I say, I am likely adding one and one and getting three!

The TBV multiples have continued to expand in 2013 as the graph below shows (market values as of the date shown against the tangible book value from the preceding quarter).

click to enlargeInsurance TBV Movement 2011 to 2013

For the market values as of today against Q3 2013 tangible book value, I fitted a S curve as below.

click to enlargeInsurance Tangible Book Value Multiples Probability Weighting Dec 2013

I am aware that the S curve is the wrong way around compared to one in the previous post but that could be rectified by flipping the axis. As I said, I haven’t really thought it through in detail but thought it was interesting all the same!

With that, I’d like to wish everybody a great Christmas and a peaceful 2014. Many thanks for your interest in my ramblings through 2013.

How P&C insurers die

The news from Tower Group International Ltd (TWGP) today has been disastrous. A $365 million reserve hit from commercial lines business and a $215 goodwill impairment charge resulted in a Fitch downgrade to below investment grade. The impact can be seen below in the recent share price collapse.

click to enlarge TWGP

Difficulties at the firm were first signalled in the postponement of its quarterly results in early August and despite some hurriedly arranged new reinsurance coverages; the future for the firm looks bleak. It yet again highlights that once confidence in an insurer’s reserves is lost, it is difficult to recover (unless like AIG you get purchased by the US government!). It also shows that intangible assets provide little comfort in distress scenarios. There are cases, such as XL Capital, where a recovery of sorts has occurred but such firms rarely recover their past glories and often end up been sold at a discount or going into run-off. It is always important to remember that insurance is a risk business where you sell a product whose cost of goods sold is not known with certainty for sometime after the point of sale.

AM Best publishes statistics on US insurance impairments, where an impairment is defined as an insurer who has been the subject of a regulatory action taken by an insurance supervisory department and can be used as a good proxy for a default. As can be seen by the pie graph below, the largest cause of impairment, by quite a distance, is inadequate pricing and reserving.

click to enlargeAM Best 2010 Impairment Study

What the exhibit above likely misses is the changing profile of the US insurance sector over the past 20 years with less small to medium sized firms and improving risk management practices. The number of impairments has being decreasing in recent years as a result of changes in the sector’s profile.

click to enlargeAM Best 2012 Historical Impairments

Let’s hope that TWGP is an exception rather than the start of a new trend.

Not all insurers’ internal models are equal

Solvency II is a worn out subject for many in the insurance industry. After over 10 years of in depth discussions and testing, the current target date of 01/01/2016 remains uncertain until the vexed issue of how long term guarantees in life business is resolved.

The aim of the proposed Solvency II framework is to ensure that (re)insurers are financially sound and can withstand adverse events in order to protect policy holders and the stability of the financial system as a whole. Somewhere along the long road to where we are now, the solvency capital requirement (SCR) in Solvency II to achieve that aim was set at an amount of economic capital corresponding to a ruin probability of 0.5% (Value at Risk or VaR of 99.5%) and a one year time horizon.

Many global reinsurers and insurers now publish outputs from their internal models in annual reports and investor presentations, most of which are set at one year 99.5% VaR or an equivalent level. Lloyds’ of London however is somewhat different. Although the whole Lloyds’ market is subject to the one year Solvency II calibration on an aggregate basis, each of the Syndicates operating in Lloyds’ have a solvency requirement based upon a 99.5% VaR on a “to ultimate” basis. In effect, Syndicates must hold additional capital to that mandated under Solvency II to take into account the variability in their results on an ultimate basis. I recently came across an interesting presentation from Lloyds’ on the difference in the SCR requirement between a one year and an ultimate basis (which requires on average a third more capital!), as the exhibit below reproducing a slide from the presentation shows.

click to enlarge

SCR one year ultimate basis

Although this aspect of Lloyds’ of London capital requirements has not been directly referenced in recent reports, their conservative approach does reflect the way the market is now run and could likely be a factor behind recent press speculation on a possible upgrade for the market to AA. Such an upgrade would be a massive competitive plus for Lloyds’.

Updated TBV multiples of specialty insurers & reinsurers

As it has been almost 6 months until my last post on the tangible book value multiples for selected reinsurers and specialty insurers I thought it was an opportune time to post an update, as per graph the below.

click to enlarge

TBV Multiples Specialty Insurers & Reinsurers September 2013I tend to focus on tangible book value as I believe it is the most appropriate metric for equity investors. Many insurers have sub-debt or hybrid instruments that is treated as equity for solvency purposes. Although these additional buffers are a comfort to regulators, they do little for equity investors in distress.

In general, I discount intangible items as I believe they are the first thing that gets written off when a business gets into trouble. The only intangible item that I included in the calculations above is the present value of future profits (PVFP) for acquired life blocks of business. Although this item is highly interest rate sensitive and may be subject to write downs if the underlying life business deteriorates, I think they do have some value. Whether its 100% of the item is something to consider. Under Solvency II, PVFP will be treated as capital (although the tiering of the item has been the subject of debate). Some firms, particularly the European composite reinsurers, have a material amount (e.g. for Swiss Re PVFP makes up 12% of shareholders equity).