Category Archives: Investing Ideas

Factors impacting AIG’s valuation

AIG stock has been the subject of much investor attention in recent times and has doubled over the past 24 months. The new AIG has become a hedge fund favourite, the 3rd most popular stock according to Goldman Sachs. I did briefly look over AIG at the end of 2010 when it traded around $35 but concluded there was too much uncertainty around its restructuring and I particularly didn’t like the P&C reserve deteriorations in 2009 and 2010. The stock fell below $25 in 2011 before reversing and beginning its recent accent above $45 as further clarity on its business performance emerged. I figured now is a good time to give the new AIG another look.

Unless you have been living on Mars, everybody is aware that AIG has had a very colourful history and, although it’s past is not the focus of this post, the graph below of the 10 year history of the stock is a reminder of the grim fate suffered by its equity holders with the current price still only about 5% of the pre-crash average. For what it is worth, the 2005 Fortune article “All I want in life is an unfair advantage” and the 2009 Vanity Fair article “The Man Who Crashed the World” by Michael Lewis are two of my favourites on the subject and worth a read.

click to enlargeAIG 10 year stock price

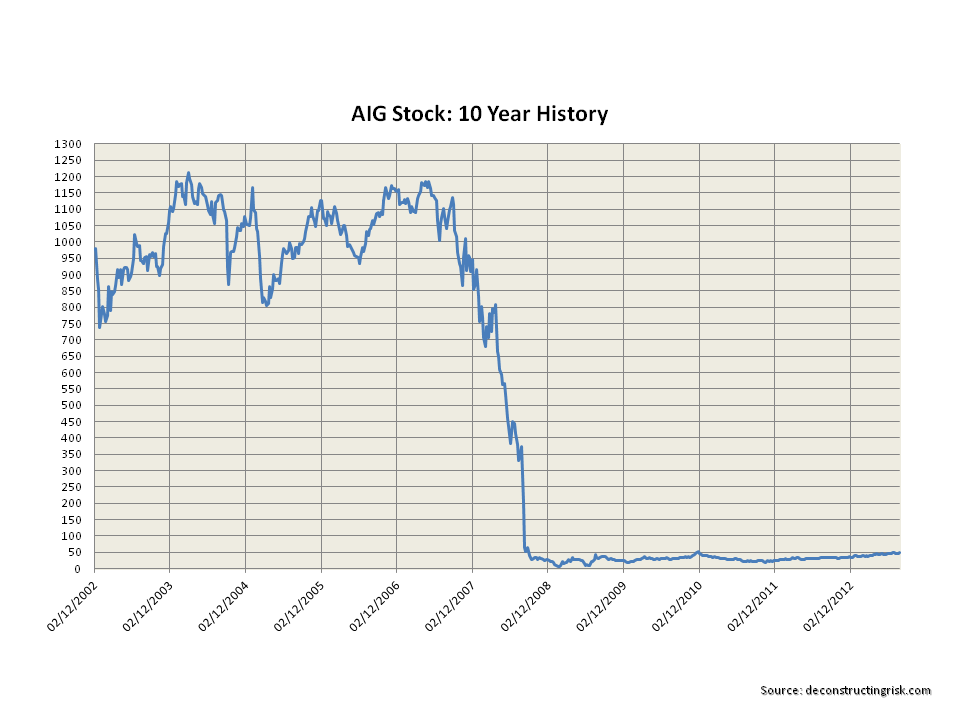
To understand the new AIG we need to review the current balance sheet and the breakdown of the sources of net income since 2010. The balance sheet (excluding segregated assets & liabilities) as at Q2 2013 is represented in the exhibit below.

click to enlargeAIG Balance Sheet & Assets

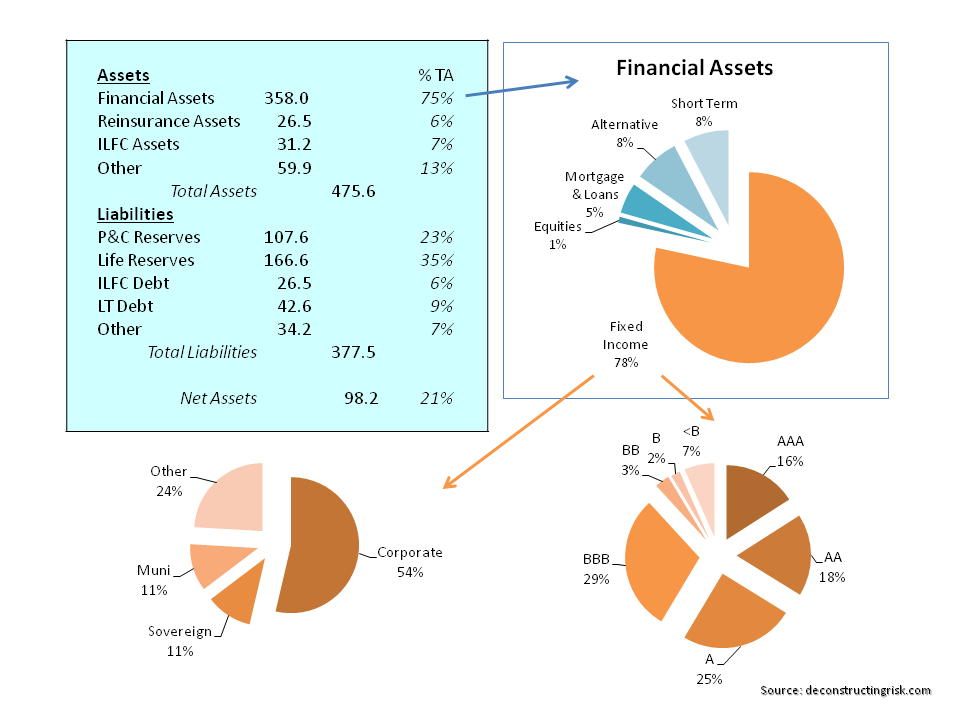
AIG’s liquid assets look reasonably diverse and creditworthy although these assets should really be looked at in their respective business units. The P&C assets are the more conservative and look in line with their peers. The life and retirement assets are riskier and reflect the underling product mix and risk profile of that business.

Another item to note is the $31.2 billion of aircraft leasing assets from ILFC against the $26.5 billion of liabilities representing $4.7 billion of net assets. AIG’s deal to sell 80% of ILFC to a Chinese consortium for book value looks like it may fall apart. If it does, the possibility of going down the IPO route is now a realistic option, absent a change in current market conditions.

The next item to note is the other assets representing 13% of total assets. These are primarily made up of $20 billion of deferred taxes, $9 billion of DAC, $14 billion of premium receivables, and $15 billion of various assets. This last item includes $2.8 billion of fair value derivative assets which correspond to $3.1 billion of fair value derivative liabilities. The notional value of these assets and liabilities is approximately $90 billion and $110 billion respectively from primarily interest rate contracts but also FX, equity, commodity and credit derivatives that are not designated for hedging purposes. The majority (about 2/3rd) of these are from the Global Capital Markets division which includes the run-off of the infamous AIG Financial Products (AIGFP) unit.

AIG’s non-life reserves, at $108 billion, have been a source of volatility in the past with significant strengthening required in 2002, 2004, 2005, 2009 and 2010. The life and retirement reserves are split $121 billion of policyholder contracts (including guaranteed variable annuity products like GMWB), $5 billion of other policyholder funds, and $40 billion of mortality and morbidity reserves.

A breakdown of AIG’s net income since 2010 shows the sources of profit and losses as per the graph below.

click to enlargeAIG Net Income Breakdown 2010 to Q22013

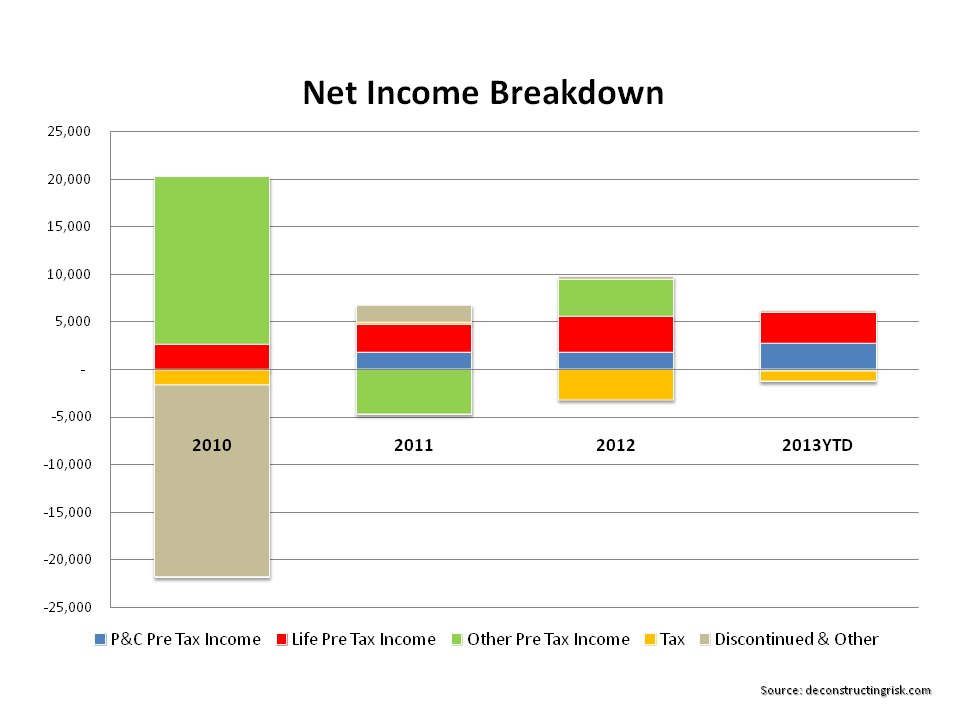
The graph shows that the impact of discontinued operations has been playing less of a part in the net income line. It also points to the need to understand the importance of the other business category in 2011 and 2012 as well as the relative underperformance in the P&C division in contributing to net income for 2010 to 2012.

In 2011, contributors to other pre-tax income included a $1.7 billion impairment charge on ILFC’s fleet and a net $2.9 billion charge due to the termination of the New York Fed credit facility. 2012 net income included a $0.8 billion gain on the sale of AIA shares and an increase of $2.9 billion in the fair value of AIG’s interest in Maiden Lane III (the vehicle created during the AIG bailout for AIGFP’s CDO credit default swap portfolio). These 2012 gains were partially offset by an increase of $0.8 billion in litigation reserves.

AIG bulls point to the 2013 YTD performance. Improved operating margins in the core P&C and life/retirement units have combined with income from the other activities (mortgage business, Global Capital Markets & Direct Investment portfolios) covering corporate and interest expenses and any other one off charges (such as those in the paragraph above). This performance has led analysts to predict 2013 EPS around $4.20 and 2014 EPS of $4.30 to $4.50.

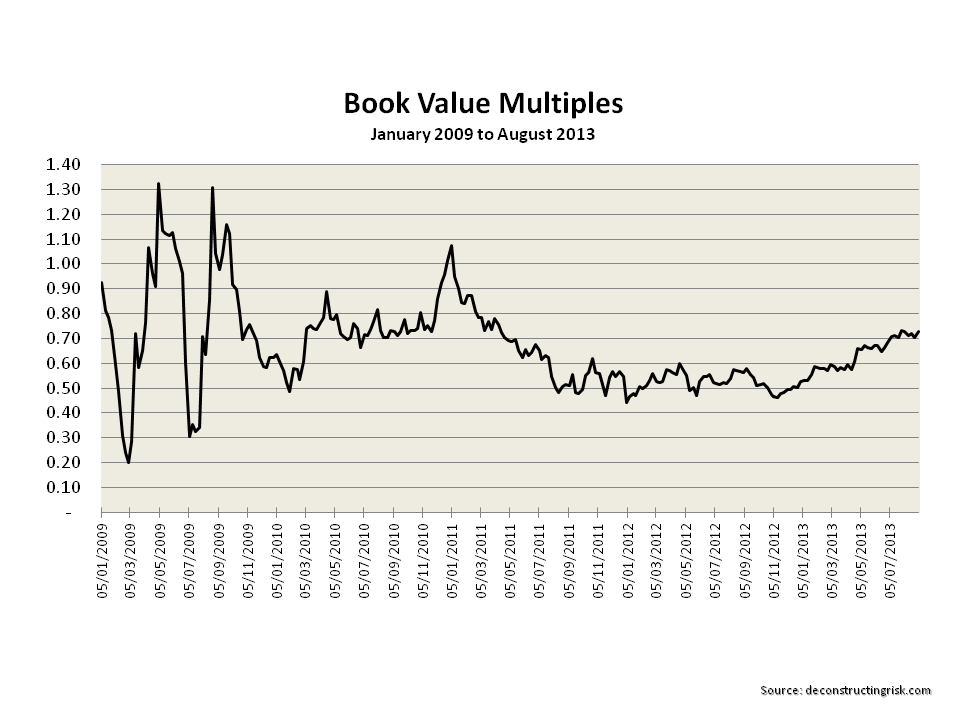
AIG has traded at a significant discount to its peers on a book value basis as a result of its troubled past and currently trades at 0.73. The graphs below uses recently published book values and book value excluding Accumulated Other Comprehensive Income (AOCI) which have been the subject to adjustment and reinstatement and may not therefore reflect the book values published at the time.

click to enlargeAIG stock price to book values 2009 to August 2013

AIG Book Value Multiples 2009 to August 2013

In summary, the factors impacting the current AIG valuation are the significant book value discount as a result of AIG’s history, the uncertainty around the ILFC sale, the future prospects of the core P&C and life/retirement units, and the historical volatility in the other operating business lines (and the potential for future volatility!). Each of these items need to be understood further before any conclusions can be reached on whether AIG is currently undervalued or overvalued. In a follow-on post on AIG I will try to dig deeper into each of these factors and also offer my thoughts on future performance and valuation of the new AIG.

Trinity Biotech valuation leaves little room for error

Trinity Biotech plc (TRIB) is a developer and manufacturer of diagnostic products for the point-of-care (POC) and clinical laboratory markets.

Trinity’s POC products primarily relate to testing for the presence of HIV antibodies and made up 23% of 2012 revenues. Within the clinical laboratory product lines, there are three product portfolios – namely infectious diseases, diabetes and life science supply.

Trinity’s largest and most diverse clinical laboratory product portfolio, at 37% of 2012 revenues, relates to tests for diagnosing a broad range of infectious diseases including kits for autoimmune diseases (e.g. lupus, celiac and rheumatoid arthritis), hormonal imbalances, sexually transmitted diseases (syphilis, chlamydia and herpes), intestinal infections, lung/bronchial infections, cardiovascular, lyme and a wide range of other diseases.

The next largest clinical laboratory product portfolio, at 28% of 2012 revenues, come from Trinity Biotech’s 2005 acquisition of Primus Corporation and primarily relate to instruments and products for in-vitro diagnostic testing, using patented HPLC (high pressure liquid chromatography) technology, for haemoglobin A1c used in the monitoring of diabetes. One of the key drivers of future growth for TRIB is its latest device, Premier Hb9210, for detecting and monitoring diabetes which was launched in 2011.

Trinity’s final clinical laboratory product portfolio, at 12% of 2012 revenues, relates to reagent products used for the diagnosis of many disease states from liver and kidney disease.

A split of TRIB’s revenues for the past 3 years by product portfolio and geographical regions is as per the graph below.

click to enlargeTRIB Revenue Split

TRIB has been on a rollercoaster ride through its past as the graph below of its share price and diluted EPS from 2000 to today shows.

click to enlargeTRIB Historical Diluted EPS and Share Price

TRIB’s shares dropped from a high of $20 in 2004 to a low just above $1 in 2009 and have since climbed steadily over the past 5 years to around $19 today. In 2007 and 2008, $19 million and $86 million of goodwill were written off in each year plus a few million in restructuring expenses and inventory over the two years after a number of missteps and lacklustre results.

In 2010, TRIB sold its lower margin coagulation business for $90 million which resulted in a net gain of $46.5 million for the 2010 financial year. Acquisitions have always been a key aspect of TRIB’s business model and following the sale of the coagulation business, TRIB acquired Phoenix Bio-tech Corp in 2011 and Fiomi Diagnostic in 2012. These companies made products for the detection of syphilis and tests for cardiac arrest and heart failure. In July 2013, TRIB announced the acquisition of Immco Diagnostics Inc for $32.75 million. Immco is a US diagnostic company specializing in the speciality autoimmune segment, where the competition is limited to a small number of key players, for conditions such as Rheumatoid Arthritis, Vasculitis, Lupus, Celiac and Crohn’s disease, Ulcerative Colitis, Neuropathy, Hashimoto’s and Graves disease.

Generally, the entire Diagnostic Industry is set to gain from the ageing population and a rising demand for rapid test evaluations. TRIB has some core product catalysts over the next few years including the ramping up of sales of the Premier instruments for diabetes, its new cardiac product portfolio from Fiomi, a new range of POC products, and now the Immco acquisition. Gross margins are around a healthy 50% with net operating margins around 20%. With no debt and a healthy cash pile (albeit a reduced one to about $30 million after the Immco acquisition), TRIB’s valuation has screamed ahead. The graph below shows its current EV/EBITDA multiple (adjusted for Immco purchase) against its peers using the analyst expected EPS growth from 2012 to 2014 (sourced from yahoo).

click to enlargeTRIB EV EBITDA Peer Multiples

TRIB’s valuation is clearly at a premium to its peers (Chembio and Orasure have their own issues and are smaller and less diversified than TRIB). So is it justified?

The first thing to note is that TRIB’s intangibles have risen steadily since the 2007/8 writedowns on recent acquisitions to $75 million at year end 2012 and may touch the $100 million mark following the acquisition of Immco (this level of intangibles has not been seen since 2007). The company does provide detail in its 20F filing on its impairment methodology and the discounts used in its goodwill calculation.

Based upon the company’s own guidance and the latest conference call, I have calculated initial EBITDA and EPS projections. Analysts estimate 0.80 and 1.06 EPS for 2013 and 2014. My projections generally agree with these EPS projections and also show EPS growth of 20% a year thereafter for 2015 to 2017. Based upon TRIB reverting to a more normal sector EV/EBITDA multiple of 15 in the medium term, I can see a reasonable target for TRIB of $30/$35 by 2016/17.

However, there is a lot of assumptions and execution risks in my analysis. My current risk appetite means that I would prefer to wait on the side-lines for a better entry point than the current $19. It seems to me that $16 or below would be an attractive risk/reward for a 3 to 4 year play (subject to relative macro-economic stability). That strategy risks the possibility of the boat already having sailed on this one as flawless execution on the Q3 and Q4 EPS may push the stock into the mid 20’s.

TRIB is a quality company with hard won experiences and an exciting product pipeline. For me, it’s a pity about the frothy valuation.

Lancashire’s recent lackluster share performance

Lancashire (LRE.L) is a London quoted specialty insurer that writes short tail (mainly insurance) business in aviation, marine, energy, property catastrophe and terrorism classes. Set up after Hurricane Katrina, the company operates a high risk high reward business model, tightly focussed by the experienced hand of CEO Richard Brindle, with an emphasis on disciplined underwriting, tight capital management and generous shareholder returns. Shareholder’s equity is managed within a range between $1 billion and $1.5 billion with numerous shareholder friendly actions such as special dividends resulting in a cumulative shareholder return of 177% since the company’s inception over 7 years ago.

I am a fan of the company and own some shares, although not as many as in the past. I like their straight forward approach and their difference in a sector full of firms that seem to read from each other’s scripts (increasingly peppered with the latest risk management speak). That said, it does have a higher risk profile than many of its peers, as a previous post on PMLs illustrated. That profile allows it to achieve such superior shareholder returns. The market has rewarded Lancashire with a premium valuation based upon the high returns achieved over its short history as a March post on valuations showed.

However, over the past 6 months, Lancashire’s share price has underperformed against its peers, initially due to concerns over property catastrophe pricing pressures and more recently it’s announcement of the purchase of Lloyds of London based Cathedral Capital.

click to enlargeLondon Market Specialty Insurers Share Price 2012 to August 2013

Cathedral’s results over the past 5 years have been good, if not in the same league as Lancashire’s, and the price paid by Lancashire at 160% of net tangible assets is not cheap. Given the financing needs of the acquisition, the lack of room for any of Lancashire’s usual special dividend treats in the near term has been a contributing factor to the recent share price declines in my opinion.

Based upon the proforma net tangible assets of Lancashire at end Q2 as per the Cathedral presentation and the circular for the share offering, the graph below shows the net tangible valuation multiples of a number of the London market insurers using net tangible asset values as at end Q2 with market values based upon todays’ closing prices.

click to enlargeLondon Market Specialty Insurers Net Tangible Book Multiples August 2013

The multiples show that the market is now valuing Lancashire’s business at a level more akin to its peers rather than the premium valuation it previously enjoyed. Clearly, the acquisition of Cathedral raises questions over whether Lancashire will maintain its uniqueness in the future. That is certainly a concern. Also, integrating the firms and their cultures is an execution risk and heading into the peak of the US wind session could prove to be unwise timing.

Notwithstanding these issues, Brindle is an experienced operator and I would suspect that he is taking full advantage of the current arbitrage opportunities (as outlined in another post). It may take a quarter or two to fully understand the impact of the Cathedral acquisition on Lancashire’s risk/reward profile. I, for one, look forward to stalking the company to find an attractive entry point for increasing my position in anticipation of the return of Lancashire’s premium multiple.

Chinese internet stocks on fire, again.

Every experienced investor, like a jaded poker player, has stories akin to bad beat tales – great investments that got away. This post is not one of those tales. Seven odd years ago I did have a look at a few of the then hot Chinese internet shares – SINA and SOHU in particular. Both were growing solidly and were valued with big future growth assumed. Given the heated valuations and the lack of a credible history at that time, I passed. I was also uncomfortable with the political risk factor.

It was therefore with interest that in recent months I noticed a few stories about stock increases in some familiar Chinese internet names. A quick look through the key statistics on Yahoo confirms that valuations remain aggressive with PEs based upon 2013 projected earnings in the 20 to 40 range across a sample of firms (albeit not as wild as in the past).  Quarterly revenue, if not profit, growth also looks healthy at 20% to 30%.  The graph below shows the share prices of some of the better known Chinese internet firms over the past seven years.

click to enlargeChinese Internet Stocks August 2013

Although I suspect my risk appetite will never be comfortable with valuations in this sector, at some stage, I’d like to dig deeper into the quality firms in this space to figure out if there is any appropriate risk/reward investment angle that I could live with (and at what entry level on valuation). If nothing else, the rise and fall over 2011 to 2012 of SINA and SOHU looks intriguing (for old time’s sake!).

Level 3 Options

Following on from my post on Level3 and prior to their quarterly results tom0rrow, I thought it was opportune to have a look at the current option pricing for Level3. With data sourced from Yahoo (which generally needs to be treated with caution), the contrast with the liquid Apple options outlined in another post could not be greater. Liquidity is a major issue to consider when looking at options for a firm like Level3. Like the stock itself, illiquid options on a historically volatile stock is not for the faint hearted. That said, the recent stability of the underlying stock over the past 18 months does potentially offer value by way of option pricing formula if Level3 is finally about to deliver on its potential.

click to enlarge 

Level 3 options July 2013

I don’t expect anything major from Level3 tomorrow and would take the selections of Robert Powell at Telecom Ramblings as a reasonable expectation. The long term key for Level3 is sustainable revenue growth but I would be happy with continued marginal movement on costs and EBITDA margin for now.