
AIG stock has been the subject of much investor attention in recent times and has doubled over the past 24 months. The new AIG has become a hedge fund favourite, the 3rd most popular stock according to Goldman Sachs. I did briefly look over AIG at the end of 2010 when it traded around $35 but concluded there was too much uncertainty around its restructuring and I particularly didn’t like the P&C reserve deteriorations in 2009 and 2010. The stock fell below $25 in 2011 before reversing and beginning its recent accent above $45 as further clarity on its business performance emerged. I figured now is a good time to give the new AIG another look.
Unless you have been living on Mars, everybody is aware that AIG has had a very colourful history and, although it’s past is not the focus of this post, the graph below of the 10 year history of the stock is a reminder of the grim fate suffered by its equity holders with the current price still only about 5% of the pre-crash average. For what it is worth, the 2005 Fortune article “All I want in life is an unfair advantage” and the 2009 Vanity Fair article “The Man Who Crashed the World” by Michael Lewis are two of my favourites on the subject and worth a read.
click to enlarge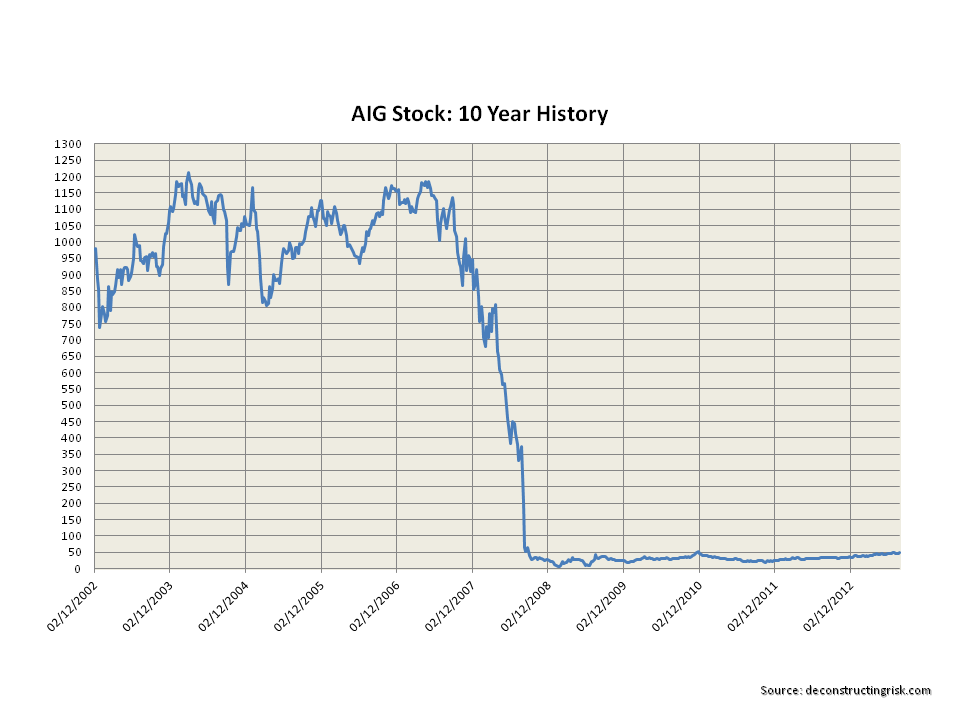
To understand the new AIG we need to review the current balance sheet and the breakdown of the sources of net income since 2010. The balance sheet (excluding segregated assets & liabilities) as at Q2 2013 is represented in the exhibit below.
click to enlarge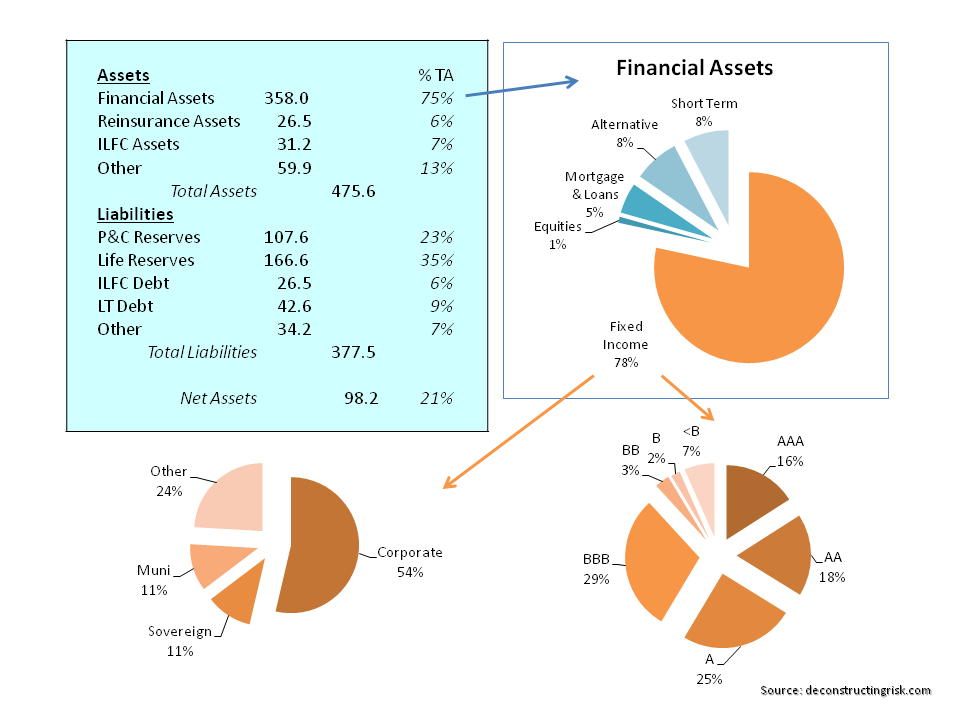
AIG’s liquid assets look reasonably diverse and creditworthy although these assets should really be looked at in their respective business units. The P&C assets are the more conservative and look in line with their peers. The life and retirement assets are riskier and reflect the underling product mix and risk profile of that business.
Another item to note is the $31.2 billion of aircraft leasing assets from ILFC against the $26.5 billion of liabilities representing $4.7 billion of net assets. AIG’s deal to sell 80% of ILFC to a Chinese consortium for book value looks like it may fall apart. If it does, the possibility of going down the IPO route is now a realistic option, absent a change in current market conditions.
The next item to note is the other assets representing 13% of total assets. These are primarily made up of $20 billion of deferred taxes, $9 billion of DAC, $14 billion of premium receivables, and $15 billion of various assets. This last item includes $2.8 billion of fair value derivative assets which correspond to $3.1 billion of fair value derivative liabilities. The notional value of these assets and liabilities is approximately $90 billion and $110 billion respectively from primarily interest rate contracts but also FX, equity, commodity and credit derivatives that are not designated for hedging purposes. The majority (about 2/3rd) of these are from the Global Capital Markets division which includes the run-off of the infamous AIG Financial Products (AIGFP) unit.
AIG’s non-life reserves, at $108 billion, have been a source of volatility in the past with significant strengthening required in 2002, 2004, 2005, 2009 and 2010. The life and retirement reserves are split $121 billion of policyholder contracts (including guaranteed variable annuity products like GMWB), $5 billion of other policyholder funds, and $40 billion of mortality and morbidity reserves.
A breakdown of AIG’s net income since 2010 shows the sources of profit and losses as per the graph below.
click to enlarge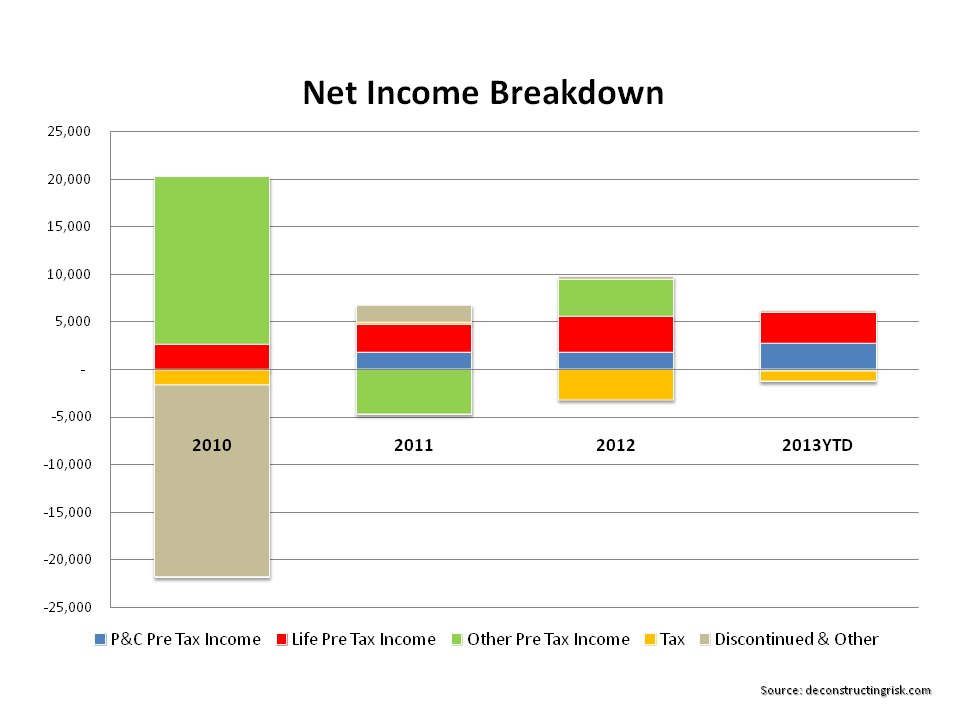
The graph shows that the impact of discontinued operations has been playing less of a part in the net income line. It also points to the need to understand the importance of the other business category in 2011 and 2012 as well as the relative underperformance in the P&C division in contributing to net income for 2010 to 2012.
In 2011, contributors to other pre-tax income included a $1.7 billion impairment charge on ILFC’s fleet and a net $2.9 billion charge due to the termination of the New York Fed credit facility. 2012 net income included a $0.8 billion gain on the sale of AIA shares and an increase of $2.9 billion in the fair value of AIG’s interest in Maiden Lane III (the vehicle created during the AIG bailout for AIGFP’s CDO credit default swap portfolio). These 2012 gains were partially offset by an increase of $0.8 billion in litigation reserves.
AIG bulls point to the 2013 YTD performance. Improved operating margins in the core P&C and life/retirement units have combined with income from the other activities (mortgage business, Global Capital Markets & Direct Investment portfolios) covering corporate and interest expenses and any other one off charges (such as those in the paragraph above). This performance has led analysts to predict 2013 EPS around $4.20 and 2014 EPS of $4.30 to $4.50.
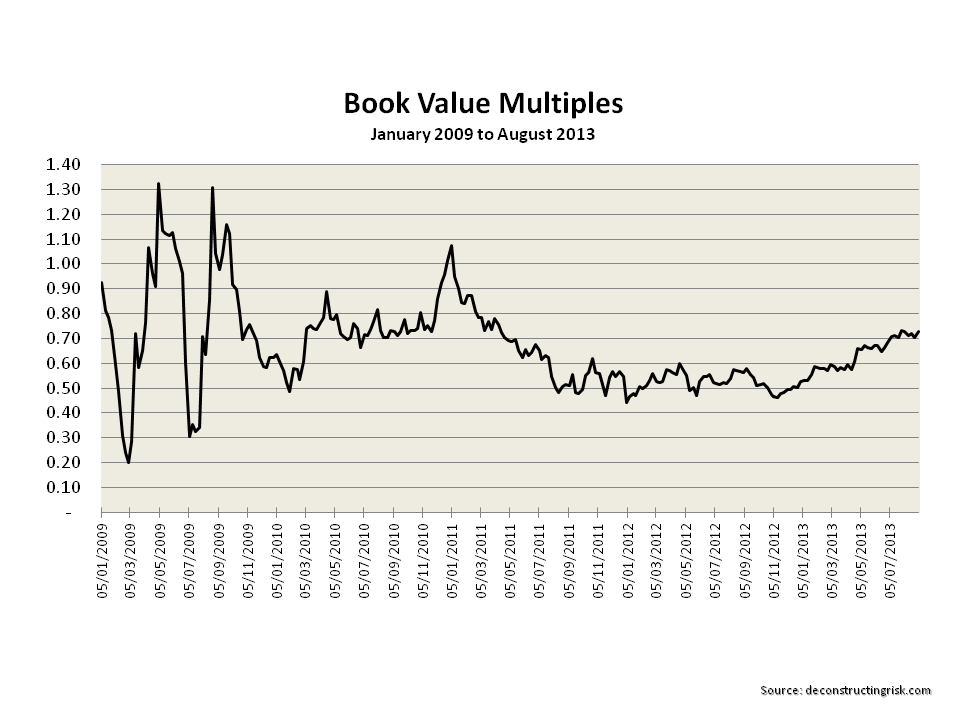
AIG has traded at a significant discount to its peers on a book value basis as a result of its troubled past and currently trades at 0.73. The graphs below uses recently published book values and book value excluding Accumulated Other Comprehensive Income (AOCI) which have been the subject to adjustment and reinstatement and may not therefore reflect the book values published at the time.
click to enlarge
In summary, the factors impacting the current AIG valuation are the significant book value discount as a result of AIG’s history, the uncertainty around the ILFC sale, the future prospects of the core P&C and life/retirement units, and the historical volatility in the other operating business lines (and the potential for future volatility!). Each of these items need to be understood further before any conclusions can be reached on whether AIG is currently undervalued or overvalued. In a follow-on post on AIG I will try to dig deeper into each of these factors and also offer my thoughts on future performance and valuation of the new AIG.

Now that is a nice coincidence. I had a good hard look at AIG myself. Really looking forward to your next post and what you will dig out.
Did you have any luck going deeper into the “Other Assets” (as of YE 2012 since this was the most comprehensive document) ? Seems to be a real hodgepodge and probably really not worth of real deep digging but I need to calm my suspicous mind :-).
Regards,
Eddie
Thanks Eddie,
I have looked through the P&C and mortgage lines and reserves, need to dig some more on life/retirement and the GCM & Direct Investment plus the expenses to get an idea of “normalised” results.
The other is a real hodge podge, I’m assuming write-downs on discontinued and aircraft leasing are done, need to look into litigation reserve further (I would of thought increasing that is an invitation to lawyers to bloodsuck!).
Although I don’t like to look at analysts reports until after I have come to a view independently, I noticed the EPS YTD is someway towards the annual estimates, need to figure that one out too!
Look forward to your comments/feedback.
Best.
M
You’re welcome !
The mortgage reserve might or might not be ok, my guts feeling is that they are a bit on the lower end (given the relatively high LTVs on their portfolio). But on the other hand we talk about a relatively small volume, so even if you bump up the reserve estimate it shouldn’t move the needle.
P&C is a different story. I think they did a reasonable / good job over the last few years, especially by shedding most of the A&E risk (retroactive reinsurance by NICO, a Berkshire subsidiary). I would think that the worst is over in terms of business written prior to 2002 in terms of reserves. They reduced their risks quite substantially since 2006, especially in Workers’ compensation and some other critical long-term lines of business. But there is still a remote chance that something pops up, so I added some margin of safety.
I struggled a bit with the Life & Retirement business. Management says that they place more risk with the customers and their sensitivities wrt rates and equity risk came down quite nicely. So that might be true (did I mention that I have a nasty suspicous mind ?) and seems to work. But I don’t know how to double-check this one.
The investment book seems reasonable to me. Duration on the P&C side is reasonably short (around 4 years), on the L&R side assets and liabilities seem matched (or so I read), so there shouldn’t be extraordinary hiccups. I also feel comforrable with the structured credit portfolio.
Litigation is tricky. They settled the Brookfield Asset Management case lately at a little under 1 bn but the rest is still open. They don’t give estimates on the potential liabilities except for one case, so one might take a reasonable discount and go for it.
Expect some earnings management… Insurance accounting gives enough leeway. Although I would guess that management has been sandbagging earnings (pumping up reserves more than necessary, increased valuation allowance on the deferred tax asset and similar stuff) to get the treasury out as cheap as possible. Again, just guessing here.
Best,
Eddie