Category Archives: Investing Ideas

Level3 Merger Follow-up

It’s now been 6 weeks since Level3 and TW Telecom announced their intention to merge, as per a previous post. Without any other bidder emerging and with the announcement of the merged entity’s intended management team, basically the existing L3 team with TW senior managers running the US business and the IT side, the deal looks like going ahead absent any unforeseen hic-cup. Level 3 released a S-4 filing which outlined the negotiations and the figures used by each sides’ advisors during the negotiations. I always find the detail behind such deals interesting reading and this is no different, albeit in this case relatively straight forward.

The valuations provided by each of the advisors yielded some interesting data. The management of each side, Level3 and TW Telecom, provide their estimates of future results which the other side then adjusted (the sensitivity case) to use as the basis for the deal. Given that each management team would have tried to maximise the value of their own firm during the negotiations, these estimates are likely optimistic projections. The graph below shows the revenue and EBITDA margin projections of each for a stand alone LVLT compared to the public analysts’ estimates (called Research Derived Projections) and my own estimates.

click to enlargeStand alone Level3 projections

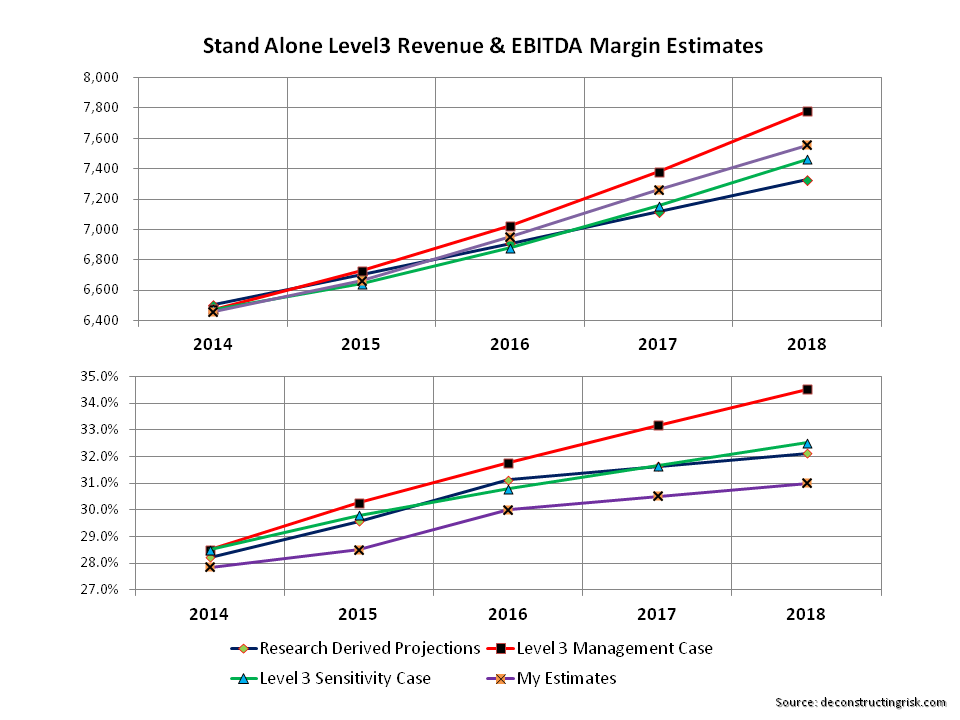
As my revenues estimates were roughly in the middle of the management estimates and the sensitivity case, I have used the average of both for my new estimates of the combined L3/TW entity as my new base case for valuation purposes. I have also used the EBITDA margin from the sensitivity case as my base with the assumed operating savings of $200 million plus the combined capex of each firm with the full savings assumed of approx $40 million, whereby both cost savings don’t fully kick-in until the 2016 year. The results for the 2016 year are not far off my initial estimates in the previous post with revenues of $8.9 billion, an EBITDA and capex margin of 34% and 15% respectively.

The S-4 outlined the different valuation methods used by the advisors, including DCF and EV/EBITDA multiples. Evercore, one of the advisors, applied a 10x to 13x 2014 EBITDA multiple to determine an implied equity value range and calculated illustrative future stock prices by applying a forward multiple range of 8.5x to 10.7x. Rothschild, another advisor, selected a range of implied EBITDA multiples of 9.5x to 10.5x. The graph below shows the historical multiples for a group of peer firms (although LVLT and TWTC tend historically be above the average peer) that I have kept track of. The graphic also includes the ranges offered by Rothschild.

click to enlargeTelecom EV Ebitda Multiple

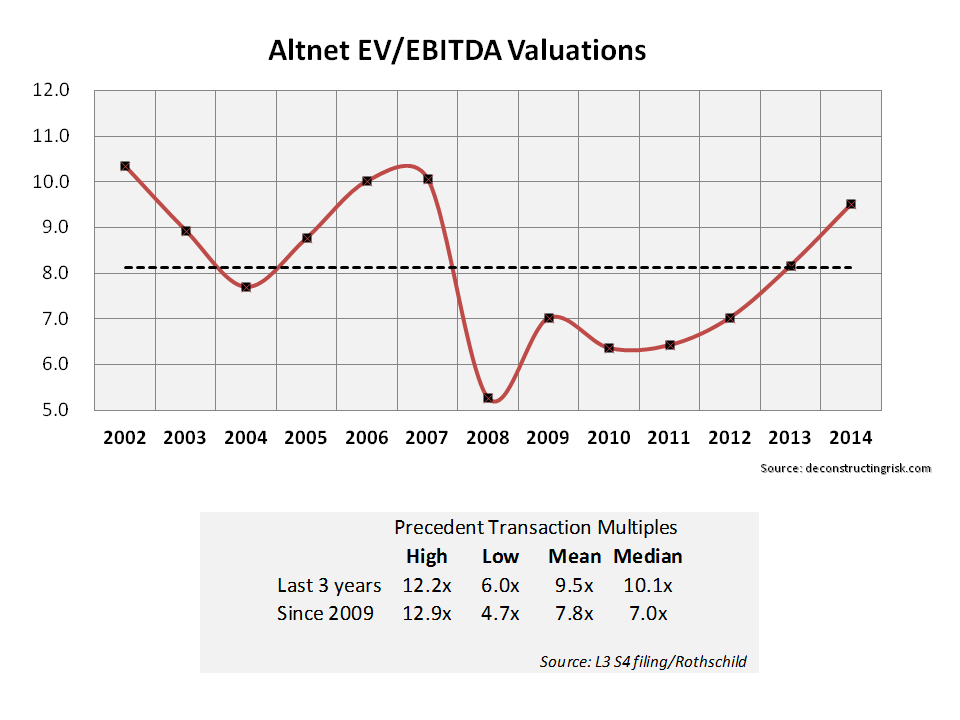
Based upon all of the assumptions above and the balance sheet details offered in the transaction presentation, I calculated the upside & downside to LVLT’s current share price based upon different multiples to the projected 2016 figures. The graph below shows the results (for multiples from 5 to 13).

click to enlargeLevel3 Upside Downside

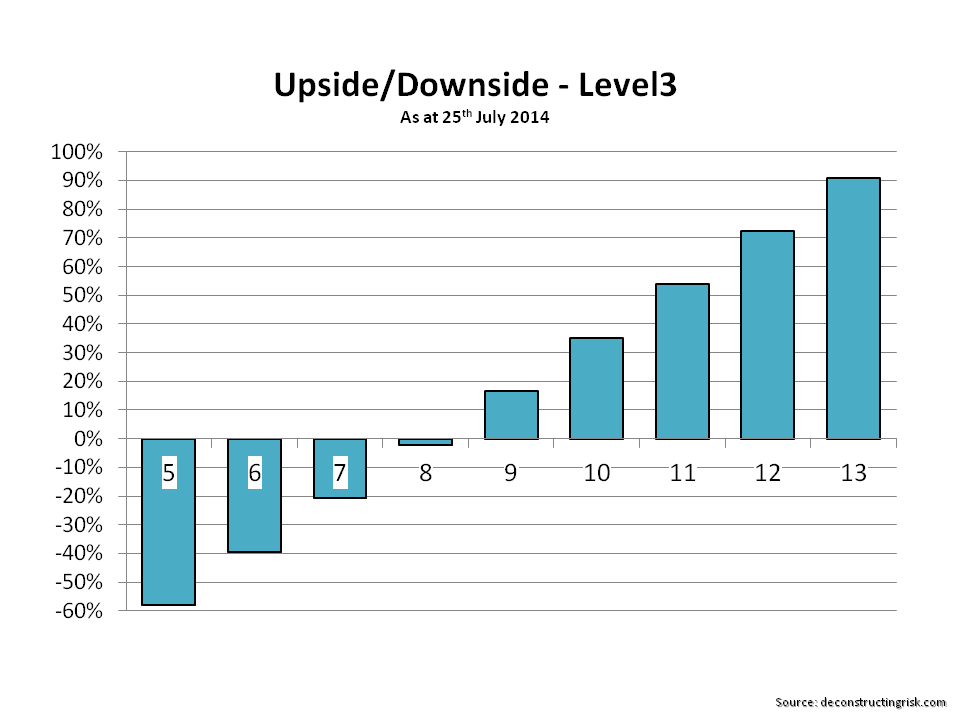
There are a lot of assumptions in the analysis above although I have tended to be conservative. That said I am conscious that LVLT has had a great run-up (equity up 110% over the past 12 months with big gains on the calls) and looks fully valued today based upon execution risks in the TWTC deal, as well as the general frothiness in the US equity market. For those who already own LVLT, buying insurance by way of the January 2015 puts around $35 looks like a sensible course of action here to me. For new comers, I would wait for a better entry point (we may get some wobbles in September although my 2013 September post on the subject last year was way off!!).

A classy telecom marriage

Two of my favourites names in the telecom space – Level 3 (LVLT) and TW Telecom (TWTC) – have announced an agreement to merge. I have posted previously on both – here and here respectively. Overall, my initial reaction is positive on the deal as I believe that LVLT have bought a quality asset, albeit at a high multiple of 12.8 times TW’s 2014 estimated EBITDA (TW’s deep metro fiber business model has a high EBITDA margin of approx 35% with a high capex spend in the low to mid 20% range).

There is always execution risk in these deals particularly when taking over a tightly managed and focussed player like TW. LVLT’s successful integration of recent M&A and the new CEO’s focus on operational results mitigates the risks somewhat. My guess is that cultural issues may be the hardest issue to manage as it looks like TWTC’s management will exit after the deal. However, the businesses are very complementary and the sector is one where scale and depth is becoming increasingly important to compete for the demands of the growing bandwidth hungry enterprise sector.

On the financials, based upon my quick and dirty analysis, I estimate that the combined entity could generate approx. $9 billion of revenue and $3 billion of EBITDA by 2016. Despite taking on extra debt for the deal, I estimate that LVLT can meet its leverage target by getting net debt to EBITDA below 3.5 by the end of 2016. Maintaining the leverage target was emphasised by LVLT during the deal presentation. At an EV/EBITDA multiple of 8.5 (assuming 350 million shares after the deal and LVLT 2015 debt conversion), a target price for LVLT of $45 looks sensible to me. Been more positive, a 9.5 multiple gives a target price of $55. Those targets may disappoint LVLT shareholders given the stock was at $44 before the deal was announced and there was further upside potential from a standalone LVLT due to the virtuous cycle of operational efficiencies, reducing interest expense, and growing core revenues .

My view is that now is the opportune for LVLT to use their highly valued stock as currency to purchase a quality asset like TWTC. A classy bride does not come cheap but over the longer term the rewards should come. Either that or you end up broke!

Slim pickings in the risk premia extraction game

One of my favourite investing quotes is one from Jim Leitner in Steve Drobny’s excellent book “The Invisible Hands” where he said “investing is the art and science of extracting risk premia from financial markets over time“. Well, there is not much over-priced risk premia to extract these days!

A recent piece on CNBC highlighted the convergence in some sovereign yields as a result of Central Bank intervention in markets. The graph below shows how the 10 year government yield from Spain has converged on that of the US.

click to enlarge10 year Government Yields

In fact, todays’ yields from Italy, Spain & Ireland are within 43, 38 & 15 basis points of the US! Does it make sense from a risk perspective that these countries are so closely priced compared to the US? Clearly not, market prices are being distorted by loose monetary policy across the developed world.

In today’s FT, Martin Wolf highlights the damage that low interest rates can do over the long term (it has been 5 years now after all). He finishes the article with this paragraph:

“Low interest rates are certainly unpopular, particularly with cautious rentiers. But cautious rentiers no longer serve a useful economic purpose. What is needed instead are genuinely risk-taking investors. In their absence, governments need to use their balance sheets to build productive assets. There is little sign that they will. If so, central banks will be driven towards cheap money. Get used to it: this will endure.”

Examples of low risk premia are everywhere. From corporate spreads (as per the graph below), to the influx of capital into insurance linked securities (ILS), to inflated valuations in the stock market.

click to enlargeFRED graph high yield vrs corporate AAA

A recent Bloomberg article cites two market strategists – Chris Verrone of Strategas Research Partners and Carter Worth of Stern Agee – who recommend the purchase of insurance to protect against a stock market pullback. The article states the following:

“While we are not ready to sell stocks across-the-board — there’s still plenty of global support from central banks — we think insuring against a potential pullback makes sense. So we are buying an at-the-money put on the S&P 500 Index with a 30-day maturity. Specifically, we’re looking at the 187 strike put which expires June 6, 2014. It costs $2.54, which equates to 1.4 percent. This is a premium we’re happy to pay in order to sleep more soundly.”

As regular readers will know, I believe a cautious approach is justified in today’s market and, where risk positions have to be maintained, protection using instruments such as options should be sought (if possible). If investing is all about extracting risk premia over time and risk premia is currently mispriced across multiple markets, then the obvious thing to do is simply to go and do something else until those markets correct.

The difficulty is that central bank strategies, as Martin Wolf highlights, are centred on keeping risk premia artificially low over the medium term to stimulate growth through consumption. It is also worrying that when David Einhorn, the hedge fund manager, got to discuss longer term monetary strategy with Ben Bernanke at a dinner in March he concluded that “it was sort of frightening because the answers were not better than I thought they would be”.

AIG still below $50: an explanation

In a previous post on AIG I tried to unpick each of the main drivers of the business and predict a “normalised” net income for 2014. Well, my estimate of $7.25 billion of net income for 2013 was blown out of the water by over $4 billion for H2 bringing the 2013 total to $9 billion. This is a massive increase on the $3.4 billion from 2012. A follow-on post in October outlined how I was surprised by a $1 billion tax benefit in Q3.

At $49, the stock currently trades at a discount of 71% to book value (incl AOCI) and 76% to book value (excl AOCI). Given the 2013 results and the successful sale of the aircraft leasing business, why is AIG not trading well above $50? Well, one reason may be that outlined in the graphic below.

click to enlargeAIG Net Income 2013 10K vrs 2012 10K

After the amount of change that AIG has gone through, reinstatements were to be expected. However, you should expect AIGs’ numbers to have stabilized by now and to be more consistent than movements of between $1.6, $0.6 & $1 billion for 2009, 2010, and 2011 as reported between the 2012 and 2013 10Ks. And a staggering $6.4 billion for 2012! How can that be? To be honest, my desire to dig deeper and find an explanation evaporated by the simple fact that it should not happen and my conviction in AIG has dropped commensurate with by disbelief.

If you believe that the movements are for rational reasons and can be taken into account in future estimates, then good luck to you. The exhibits below represents what the latest 10K figures show.

The breakdown of “normalised” pre-tax income below (excluding items from AIA, ML III, aircraft leasing & debt restructures) shows consistent contributions from the “hodge-podge” of the mortgage business, GCM and DIB (combined up to $2.4 billion in 2013 from $2.2 billion in 2012). The P&C contribution is up considerably from 2011 & 2012 around $2 billion to over $5 billion. Life & retirement is also up to $6.5 billion in 2013 from under $4 billion in 2012 and approx $3 billion in 2011

click to enlargeAIG PreTax income 2001 to 2013

The P&C improvement in pre-tax income is primarily due to improvements in the US commercial & other business lines. The US commercial business benefited from a light 2013 catastrophe year whilst the other business segment had a lower underwriting loss and high investment income. The expense ratio, particularly in the international segment, remains high.

click to enlargeAIG Inc - P&C PreTax income 2001 to 2013

Life & retirement benefited from good top-line growth, a $1 billion legal settlement, and $2 billion of realized capital gains.

After taking the 2013 trends into account and taking out some 2013 one-offs and including an average US catastrophe year, my previous estimate of a “normalised” $6.5 billion of net income for 2014 and a $60-$70 price target over 12-18 months does not seem unreasonable. That’s if you have confidence in the reported 2013 figures. Which, based upon the first exhibit above, I don’t.