Tag Archives: catastrophic models

Mega-Tsunami Fright Scenario

There was a nice piece on the online FT on the forces impacting the reinsurance sector last night. Lancashire, which is behaving oddly these days, was one of the firms mentioned. Lancashire looks like its set to drop by approximately 12% (the amount of the special dividend) when it goes ex-dividend after today the 28th (although yahoo has been shown it dropping by 10%-12% at the end of trading for several days now, including yesterday). If it does drop to a £5.50 level, that’s approximately a 123% price to diluted tangible book value. Quite a come down from the loftier valuations of 150%-170% under previous CEO Richard Brindle!

Anyway, this post is not about that. A major part of modern risk management in the insurance sector today is applying real life scenarios to risk portfolios to assess their impact. Lloyds’ has being doing it for years with their realistic disaster scenarios (RDS). Insurers are adept at using scenarios generating by professional catastrophic models from firms like RMS and AIR on so-called peak zones like US hurricanes or Japan earthquake. Many non-peak scenarios are not explicitly modelled by such firms.

The horrors of the tsunamis from the 2011 Tōhoku and the 2004 Indian Ocean earthquakes have been brought home vividly in this multi-media age. The damage in human terms from the receding waters full of debris makes the realities of such events all too real.  Approximately 80% of tsunamis come from earthquakes and history is littered with examples of large destructive tsunami resulting from earthquakes – the 1755 Great Lisbon earthquake in Portugal, the 1783 Calabrian and the 1908 Messina earthquakes in Italy, the 1896 Sanriku earthquake in Japan, the recently discovered 365 AD Mediterranean quake, the 1700 Cascadia Megathrust earthquake in the west coast of the US, and the 1958 Lituya Bay quake in Alaska are but a few examples.

Volcanoes are another potential cause of mega tsunamis as many volcanoes are found next to the sea, notably in countries bordering the Pacific Ocean, the northern Mediterranean and the Caribbean Sea.  One scenario put forward by a paper from Steven Ward and Simon Day in 2001 is the possibility of a mega tsunami from a collapse of an unstable volcanic ridge caused by previous Cumbre Vieja volcanoes in 1949 and 1971 in La Palma in the Canary Islands. The threat was has been dramatically brought to life by a 2013 BBC Horizon programme called “Could We Survive A Mega-Tsunami?”. Unfortunately I could not find a link to the full programme but a taster can be found here.

The documentary detailed a scenario where a future eruption could cause a massive landslide of 500 km3 of rock crashing into the sea, causing multiple waves that would travel across the Atlantic Ocean and devastate major cities along the US east coast, as well as parts of Africa, Europe and southern England & Ireland. The damage would be unimaginable, causing over 4 million deaths and economic losses of over $800 billion. The impact of the damage on port and transport infrastructure would also result in horrible after event obstacles to rescue and recovery efforts.

The possibility of such a massive landslide resulting from a La Palma volcano has been disputed by many scientists. In 2006, Dutch scientists released research which stipulated that the south west flank of the island was stable and unlikely to fall into the sea for at least another 10,000 years. More recent research in 2013, has shown that 8 historical landslides associated with volcanoes in the Canary Islands have been staggered in discrete landslides and that the likelihood of one large 500 km3 landslide is therefore extremely remote. The report states:

“This has significant implications for geohazard assessments, as multistage failures reduce the magnitude of the associated tsunami. The multistage failure mechanism reduces individual landslide volumes from up to 350 km3 to less than 100 km3. Thus although multistage failure ultimately reduce the potential landslide and tsunami threat, the landslide events may still generate significant tsunamis close to source.”

Another graph from the research shows that timeframe over which such events should be viewed is in the thousands of years.

click to enlargeHistorical Volcanic & Landslide Activity Canary Islands

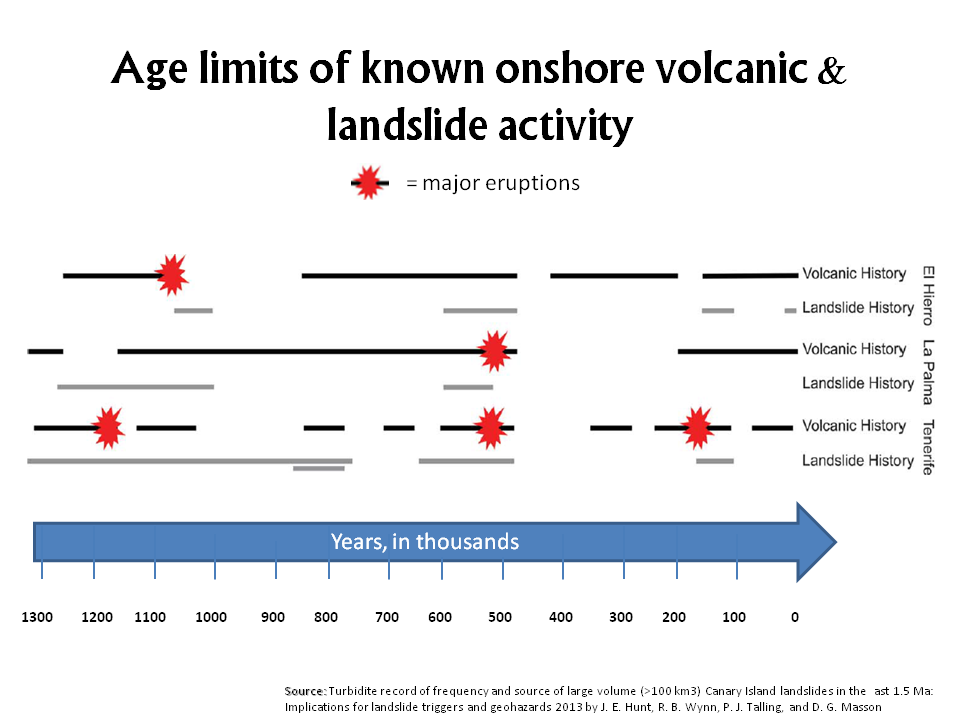
Whatever about the feasibility of the events dramatised in the BBC documentary, the scientists behind the latest research do highlight the difference between probability of occurrence and impact upon occurrence.

“Although the probability of a large-volume Canary Island flank collapse occurring is potentially low, this does not necessarily mean that the risk is low. Risk is dependent both on probability of occurrence and the resultant consequences of such events, namely generation of a tsunami(s). Therefore, determining landslide characteristics of past events will ultimately better inform tsunami modelling and risk assessments.”

And, after all, that’s what good risk management should be all about. Tsunami are caused by large infrequent events so, as with all natural catastrophes, we should be wary that historical event catalogues may be a poor guide to future hazards.

The imperfect art of climate change modelling

The completed Group I report from the 5th Intergovernmental Panel on Climate Change (IPCC) assessment was published in January (see previous post on summary report in September). One of the few definite statements made in the report was that “global mean temperatures will continue to rise over the 21st century if greenhouse gas (GHG) emissions continue unabat­ed”. How we measure the impact of such changes is therefore incredibly important. A recent article in the FT by Robin Harding on the topic which highlighted the shortcomings of models used to assess the impact of climate change therefore caught my attention.

The article referred to two academic papers, one by Robert Pindyck and another by Nicholas Stern, which contained damning criticism of models that integrate climate and economic models, so called integrated assessment models (IAM).

Pindyck states that “IAM based analyses of climate policy create a perception of knowledge and precision, but that perception is illusory and misleading”. Stern also criticizes IAMs stating that “assumptions built into the economic modelling on growth, damages and risks, come close to assuming directly that the impacts and costs will be modest and close to excluding the possibility of catastrophic outcomes”.

These comments remind me of Paul Wilmott, the influential English quant, who included in his Modeller’s Hippocratic Oath the following: “I will remember that I didn’t make the world, and it doesn’t satisfy my equations” (see Quotes section of this website for more quotes on models).

In his paper, Pindyck characterised the IAMs currently used into 6 core components as the graphic below illustrates.

click to enlargeIntegrated Assessment Models

Pindyck highlights a number of the main elements of IAMs which involve a considerable amount of arbitrary choice, including climate sensitivity, the damage and social welfare (utility) functions. He cites important feedback loops in climates as difficult, if not impossible, to determine. Although there has been some good work in specific areas like agriculture, Pindyck is particularly critical on the damage functions, saying many are essentially made up. The final piece on social utility and the rate of time preference are essentially policy parameter which are open to political forces and therefore subject to considerable variability (& that’s a polite way of putting it).

The point about damage functions is an interesting one as these are also key determinants in the catastrophe vendor models widely used in the insurance sector. As a previous post on Florida highlighted, even these specific and commercially developed models result in varying outputs.

One example of IAMs directly influencing current policymakers is those used by the Interagency Working Group (IWG) which under the Obama administration is the entity that determines the social cost of carbon (SCC), defined as the net present damage done by emitting a marginal ton of CO2 equivalent (CO2e), used in regulating industries such as the petrochemical sector. Many IAMs are available (the sector even has its own journal – The Integrated Assessment Journal!) and the IWG relies on three of the oldest and most well know; the Dynamic Integrated Climate and Economy (DICE) model, the Policy Analysis of the Greenhouse Effect (PAGE) model, and the fun sounding Climate Framework for Uncertainty, Negotiation, and Distribution (FUND) model.

The first IWG paper in 2010 included an exhibit, reproduced below, summarizing the economic impact of raising temperatures based upon the 3 models.

click to enlargeClimate Change & Impact on GDP IWG SCC 2010

To be fair to the IWG, they do highlight that “underlying the three IAMs selected for this exercise are a number of simplifying assumptions and judgments reflecting the various modelers’ best attempts to synthesize the available scientific and economic research characterizing these relationships”.

The IWG released an updated paper in 2013 whereby revised SCC estimates were presented based upon a number of amendments to the underlying models. Included in these changes are revisions to damage functions and to climate sensitivity assumptions. The results of the changes on average and 95th percentile SCC estimates, at varying discount rates (which are obviously key determinants to the SCC given the long term nature of the impacts), can be clearly seen in the graph below.

click to enlargeSocial Cost of Carbon IWG 2010 vrs 2013

Given the magnitude of the SCC changes, it is not surprising that critics of the charges, including vested interests such as petrochemical lobbyists, are highlighting the uncertainty in IAMs as a counter against the charges. The climate change deniers love any opportunity to discredit the science as they demonstrated so ably with the 4th IPCC assessment. The goal has to be to improve modelling as a risk management tool that results in sensible preventative measures. Pindyck emphasises that his criticisms should not be an excuse for inaction. He believes we should follow a risk management approach focused on the risk of catastrophe with models updated as more information emerges and uses the threat of nuclear oblivion during the Cold War as a parallel. He argues that “one can think of a GHG abatement policy as a form of insurance: society would be paying for a guarantee that a low-probability catastrophe will not occur (or is less likely)”. Stern too advises that our focus should be on potential extreme damage and that the economic community need to refocus and combine current insights where “an examination and modelling of ways in which disruption and decline can occur”.

Whilst I was looking into this subject, I took the time to look over the completed 5th assessment report from the IPCC. First, it is important to stress that the IPCC acknowledge the array of uncertainties in predicting climate change. They state the obvious in that “the nonlinear and chaotic nature of the climate system imposes natu­ral limits on the extent to which skilful predictions of climate statistics may be made”. They assert that the use of multiple scenarios and models is the best way we have for determining “a wide range of possible future evolutions of the Earth’s climate”. They also accept that “predicting socioeconomic development is arguably even more difficult than predicting the evolution of a physical system”.

The report uses a variety of terms in its findings which I summarised in a previous post and reproduce below.

click to enlargeIPCC uncertainty

Under the medium term prediction section (Chapter 11) which covers the period 2016 to 2035 relative to the reference period 1986 to 2005, a number of the notable predictions include:

  • The projected change in global mean surface air temperature will likely be in the range 0.3 to 0.7°C (medium confidence).
  • It is more likely than not that the mean global mean surface air temperature for the period 2016–2035 will be more than 1°C above the mean for 1850–1900, and very unlikely that it will be more than 1.5°C above the 1850–1900 mean (medium confidence).
  • Zonal mean precipitation will very likely increase in high and some of the mid-latitudes, and will more likely than not decrease in the subtropics. The frequency and intensity of heavy precipitation events over land will likely increase on average in the near term (this trend will not be apparent in all regions).
  • It is very likely that globally averaged surface and vertically averaged ocean temperatures will increase in the near term. It is likely that there will be increases in salinity in the tropical and (especially) subtropical Atlantic, and decreases in the western tropical Pacific over the next few decades.
  • In most land regions the frequency of warm days and warm nights will likely increase in the next decades, while that of cold days and cold nights will decrease.
  • There is low confidence in basin-scale projections of changes in the intensity and frequency of tropical cyclones (TCs) in all basins to the mid-21st century and there is low confidence in near-term projections for increased TC intensity in the North Atlantic.

The last bullet point is especially interesting for the insurance sector involved in providing property catastrophe protection. Graphically I have reproduced two interesting projections below (Note: no volcano activity is assumed).

click to enlargeIPCC temperature near term projections

Under the longer term projections in Chapter 12, the IPCC makes the definite statement that opened this post. It also states that it is virtually certain that, in most places, there will be more hot and fewer cold temperature extremes as global mean temper­atures increase and that, in the long term, global precipitation will increase with increased global mean surface temperature.

I don’t know about you but it seems to me a sensible course of action that we should be taking scenarios that the IPCC is predicting with virtual certainty and applying a risk management approach to how we can prepare for or counteract extremes as recommended by experts such as Pindyck and Stern.

The quote “it’s better to do something imperfectly than to do nothing perfectly” comes to mind. In this regard, for the sake of our children at the very least, we should embrace the imperfect art of climate change modelling and figure out how best to use them in getting things done.