One of the reasons given by market participants for competitive pricing in the ILS markets is the lower cost of capital required by such instruments due to the uncorrelated nature of the underlying exposure with other classes. I previously posted on the lower risk return for an ILS fully collaterised portfolio against a similar portfolio written by a mono-line property catastrophe reinsurer. The ILS investor may be prepared to accept a lower return due to the uncorrelated nature of the exposure. It is nonetheless resulting in lower prices for risk which has always ended badly in the past.
Twelve Capital are a well known ILS investment manager and recently published a white paper on the impact of ILS capital on the reinsurance industry. I liked the way they described the lower cost of capital issue, as below:
“Equity is the most expensive form of capital for the (re)insurance industry. Thanks to its diversification benefits, ILS is the cheapest. The most popular form of investment for those looking to enter the reinsurance market was, prior to the birth of ILS, equity offered by traditional reinsurers. However, returns on equity are eroded by company management costs and the tendency of reinsurers to diversify into less profitable lines of business. In addition, financial market investments on the asset side of the balance sheet expose reinsurance shareholders to additional financial market risks. A listed reinsurance stock thus has the disadvantage of being highly correlated to equity markets in general.
So, what ought to be a fundamentally uncorrelated investment gets transformed into a correlated investment, and the diversification benefit is lost. The investor is also exposed to the risk that the management of reinsurance companies might not always act in the best interests of shareholders.
As insurance investors focus on those lines of business that are favourably priced and soundly modelled, reinsurance companies might end up losing their most profitable lines to the ILS market. And it is this source of profit that reinsurers have traditionally relied upon to support and cross-subsidise substantial volumes of business that generally only break even. With profitable lines taken away by more efficient investors, reinsurance companies are left with business models that cannot sustain conventional cross-subsidisation.”
The comment on reinsurer’s management is a bit below the belt! The impact of the loss of the low frequency/high severity business to the traditional market is a valid one though. However, the long histories of the largest tier 1 reinsurers with large diverse portfolios and the ability to provide products and services across most business lines and jurisdictions indicate more robust business models than the commentary suggests in my opinion.
My previous post looked at the capital return of a fully collaterised provider such as an ILS fund against a mono-line catastrophe provider such as a property cat reinsurer. To see if the commentary above on a correlated investment is reflective of actual experience, the graph below shows the S&P500 against the share prices of the property catastrophe reinsurers Renaissance Re, Validus Re, Montpelier Re and Platinum Re since late 2002. Excluding Montpelier Re, which obviously had some company specific issues after the 2005 wind losses, the R2 for the other firms is remarkably similar around 65%. This suggests investing in the equity of these firms has indeed been a correlated investment in the past.
click to enlarge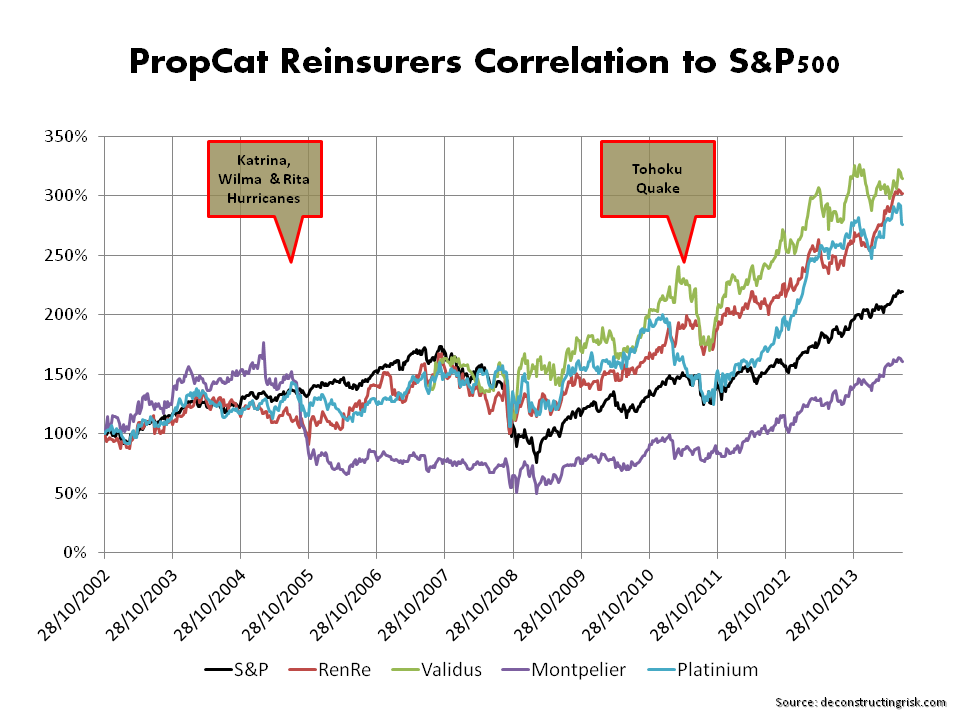
It emphasises that the traditional reinsurance market needs to focus on reducing such correlation, whether real or wrongly perceived, to compete better for this cheap capital.