Tag Archives: solvency ii

What now for “too big to fail” insurers on G-SII list?

Insurers and industry participants have reacted with the expected bemusement to the announcement on the 18th of July from the Financial Stability Board (FSB) on the list of “too big to fail” insurers, aka G-SIIs or Global Systemically Important Insurers. To be fair, the list of nine – three US, five European and one Chinese – does look inconsistent. No Japanese for example or the inclusion of Aviva but the exclusion of Zurich.

Industry groups such as the Geneva Association and Insurance Europe have asked for clarity on the criteria and more disclosure on the impact. The timetable released by the FSB includes announcing the reinsurers to be designated as G-SIIs by mid 2014 (now that will be interesting given the global focus of a reinsurer’s business model) and the finalization of the additional loss absorption measures for G-SIIs by the end of 2015 with an implementation date of the start of 2019.

The generous diversification credits that large insurers have calculated using economic capital models (likely to be used under Solvency II) can be seen in the graph below based upon data from a sample of published results from 2012 annual reports of a number of European insurance groups.

click to enlarge

Capital Model Breakdown European Insurers YE2012

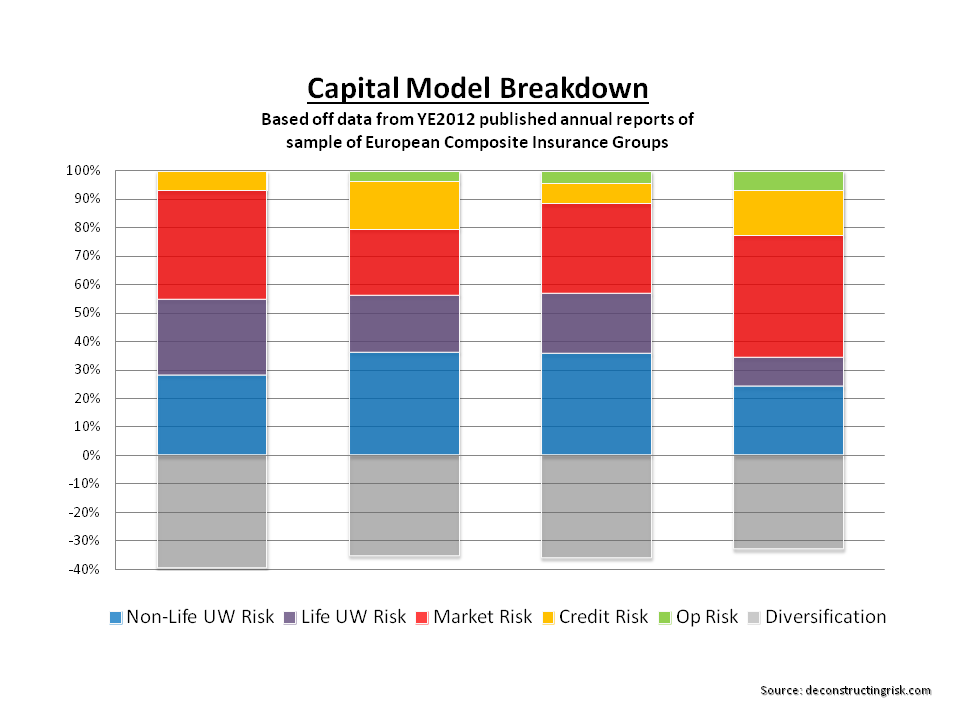
The graph shows assumed diversification across risk modules of 30% to 40% but does not show the significant diversification assumed by insurers within risk modules, particularly for the larger firms with a wide spread of business classes. Munich Re, for example, highlights a further 30% and 50% discount in their non-life underwriting risk and market risk modules respectively. Aviva is perhaps startlingly open when it revealed, in its year end results presentation, a diversification discount within its business unit of 45% and a further diversification discount across business units and jurisdictions of 40%. Their gross undiversified capital of £31 billion reduced by 68% to £10 billion after been sprinkled with the diversification magic dust.

Given the competitive advantage that size and diversity brings under the risk based regulatory capital systems being introduced or planned for introduction across the globe, the large insurance groups just named as G-SIIs will likely step up their lobbying efforts to a new level in the next few years against any costly or detrimental measures by the FSB that could impact their hard won competitive advantage. Another avenue for the G-SII to negate any capital impact is to sharper their pencils further on the diversification effects calculated in their economic capital models!

Relative valuations of selected reinsurers and wholesale insurers

It’s been a great 12 months for wholesale insurers with most seeing their share price rise by 20%+, some over 40%. As would be expected, there has been some correlation between the rise in book values and the share price increase although market sentiment to the sector and the overall market rally have undoubtedly also played their parts. The graph below shows the movements over the past 12 months (click to enlarge).

12 month share price change selected reinsurers March 2013The price to tangible book is one of my preferred indicators of value although it has limitations when comparing companies reporting under differing accounting standards & currencies and trading in different exchanges. The P/TBV valuations as at last weekend are depicted in the graph below. The comments in this post are purely made on the basis of the P/TBV metric calculated from published data and readers are encouraged to dig deeper.

I tend to look at the companies relative to each other in 4 broad buckets – the London market firms, the continental European composite reinsurers, the US/Bermuda firms, and the alternative asset or “wannabe buffet” firms.  Comparisons across buckets can be made but adjustments need to be made for factors such as those outlined in the previous paragraph. Some firms such as Lancashire actually report in US$ as that is where the majority of their business is but trade in London with sterling shares. I also like to look at the relative historical movements over time & the other graph below from March 2011 helps in that regard.

Valuations as at March 2013 (click to enlarge):

Price to net tangible book & 5 year average ROE reinsurers March 2013

Valuations as at March 2011 (click to enlarge):

Price to net tangible book & 5 year average ROE reinsurers March 2011 The London market historically trades at the highest multiples – Hiscox, Amlin, & Lancashire are amongst the leaders, with Catlin been the poor cousin. Catlin’s 2012 operating results were not as strong as the others but the discount it currently trades at may be a tad unfair. In the interest of open disclosure, I must admit to having a soft spot for Lancashire. Their consistent shareholder friendly actions result in the high historical valuation. These actions and a clear communication of their straight forward business strategy shouldn’t distract investors from their high risk profile. The cheeky way they present their occurrence PMLs in public disclosures cannot hide their high CAT exposures when the occurrence PMLs are compared to their peers on a % of tangible asset basis. Their current position relative to Hiscox and Amlin may be reflective of this (although they tend to go down when ex dividend, usually a special dividend!).

Within the continental European composite reinsurer bucket, the Munich and Swiss, amongst others, classify chunky amounts of present value of future profits from their life business as an intangible. As this item will be treated as capital under Solvency II, further metrics need to be considered when looking at these composite reinsurers. The love of the continental Europeans of hybrid capital and the ability to compare the characteristics of the varying instruments is another factor that will become clearer in a Solvency II world. Compared to 2011 valuations Swiss Re has been a clear winner. It is arguable that the Munich deserves a premium given it’s position in the sector.

The striking thing about the current valuations of the US/Bermudian bucket is how concentrated they are, particularly when compared to 2011. The market seems to be making little distinction between the large reinsurers like Everest and the likes of Platinum & Montpelier. That is surely a failure of these companies to distinguish themselves and effectively communicate their differing business models & risk profiles.

The last bucket is the most eccentric. I would class firms such as Fairfax  in this bucket. Although each firm has its own twist, generally these companies are interested in the insurance business as the provider of cheap “float”, a la Mr Buffet, with the focus going into the asset side. Generally, their operating results are poorer than their peers and they have a liking for the longer tail business if the smell of the float is attractive enough (which is difficult with today’s interest rate). This bucket really needs to be viewed through different metrics which we’ll leave for another day.

Overall then, the current valuations reflect an improved sentiment on the sector. Notwithstanding the musings above, nothing earth shattering stands out based solely on a P/TBV analysis.  The ridiculously low valuations of the past 36 months aren’t there anymore. My enthusiasm for the sector is tempered by the macro-economic headwinds, the overall run-up in the market (a pull-back smells inevitable), and the unknown impact upon the sector of the current supply distortions from yield seeking capital market players entering the market.