Tag Archives: tangible book value multiples

Insurance TBV Multiples & Probability Weighting

Likely proving that a little knowledge is a dangerous thing, I was looking over the insurance tangible book value (TBV) multiples that I monitor and it stuck me that the S shaped curve from prospect theory may be more suitable than a linear fit. As I say, I am likely adding one and one and getting three!

The TBV multiples have continued to expand in 2013 as the graph below shows (market values as of the date shown against the tangible book value from the preceding quarter).

click to enlargeInsurance TBV Movement 2011 to 2013

For the market values as of today against Q3 2013 tangible book value, I fitted a S curve as below.

click to enlargeInsurance Tangible Book Value Multiples Probability Weighting Dec 2013

I am aware that the S curve is the wrong way around compared to one in the previous post but that could be rectified by flipping the axis. As I said, I haven’t really thought it through in detail but thought it was interesting all the same!

With that, I’d like to wish everybody a great Christmas and a peaceful 2014. Many thanks for your interest in my ramblings through 2013.

Updated TBV multiples of specialty insurers & reinsurers

As it has been almost 6 months until my last post on the tangible book value multiples for selected reinsurers and specialty insurers I thought it was an opportune time to post an update, as per graph the below.

click to enlarge

TBV Multiples Specialty Insurers & Reinsurers September 2013I tend to focus on tangible book value as I believe it is the most appropriate metric for equity investors. Many insurers have sub-debt or hybrid instruments that is treated as equity for solvency purposes. Although these additional buffers are a comfort to regulators, they do little for equity investors in distress.

In general, I discount intangible items as I believe they are the first thing that gets written off when a business gets into trouble. The only intangible item that I included in the calculations above is the present value of future profits (PVFP) for acquired life blocks of business. Although this item is highly interest rate sensitive and may be subject to write downs if the underlying life business deteriorates, I think they do have some value. Whether its 100% of the item is something to consider. Under Solvency II, PVFP will be treated as capital (although the tiering of the item has been the subject of debate). Some firms, particularly the European composite reinsurers, have a material amount (e.g. for Swiss Re PVFP makes up 12% of shareholders equity).

Lancashire’s recent lackluster share performance

Lancashire (LRE.L) is a London quoted specialty insurer that writes short tail (mainly insurance) business in aviation, marine, energy, property catastrophe and terrorism classes. Set up after Hurricane Katrina, the company operates a high risk high reward business model, tightly focussed by the experienced hand of CEO Richard Brindle, with an emphasis on disciplined underwriting, tight capital management and generous shareholder returns. Shareholder’s equity is managed within a range between $1 billion and $1.5 billion with numerous shareholder friendly actions such as special dividends resulting in a cumulative shareholder return of 177% since the company’s inception over 7 years ago.

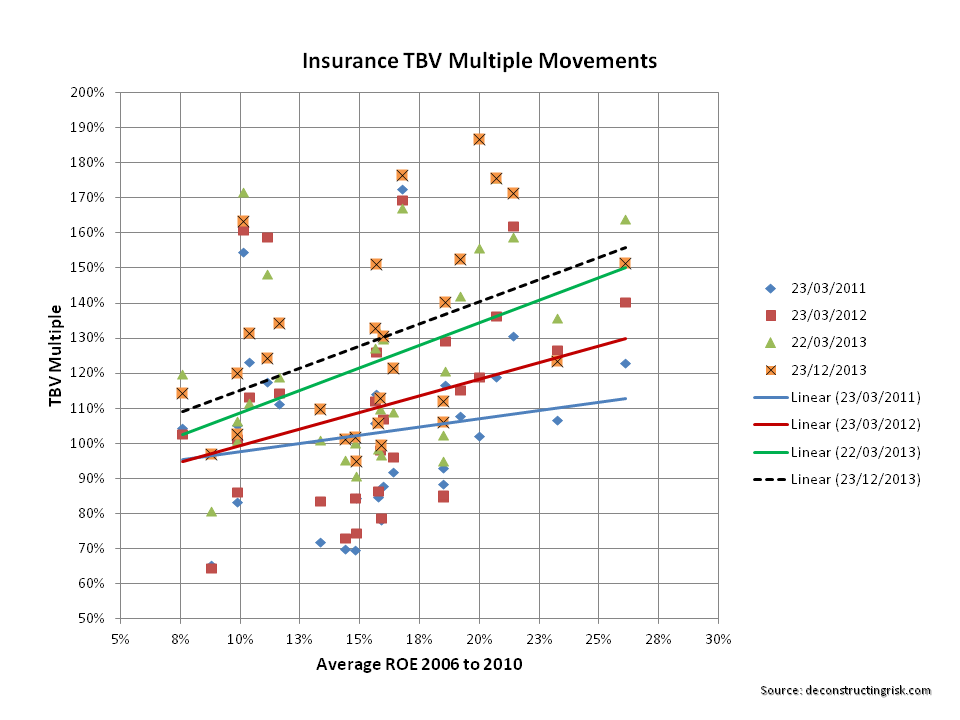
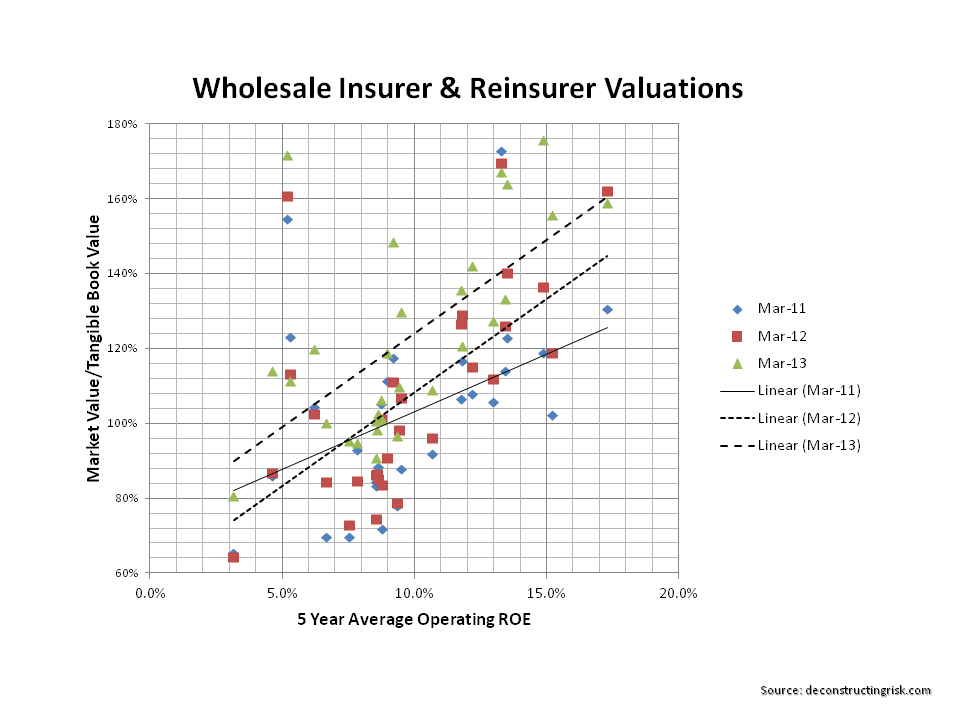
I am a fan of the company and own some shares, although not as many as in the past. I like their straight forward approach and their difference in a sector full of firms that seem to read from each other’s scripts (increasingly peppered with the latest risk management speak). That said, it does have a higher risk profile than many of its peers, as a previous post on PMLs illustrated. That profile allows it to achieve such superior shareholder returns. The market has rewarded Lancashire with a premium valuation based upon the high returns achieved over its short history as a March post on valuations showed.

However, over the past 6 months, Lancashire’s share price has underperformed against its peers, initially due to concerns over property catastrophe pricing pressures and more recently it’s announcement of the purchase of Lloyds of London based Cathedral Capital.

click to enlargeLondon Market Specialty Insurers Share Price 2012 to August 2013

Cathedral’s results over the past 5 years have been good, if not in the same league as Lancashire’s, and the price paid by Lancashire at 160% of net tangible assets is not cheap. Given the financing needs of the acquisition, the lack of room for any of Lancashire’s usual special dividend treats in the near term has been a contributing factor to the recent share price declines in my opinion.

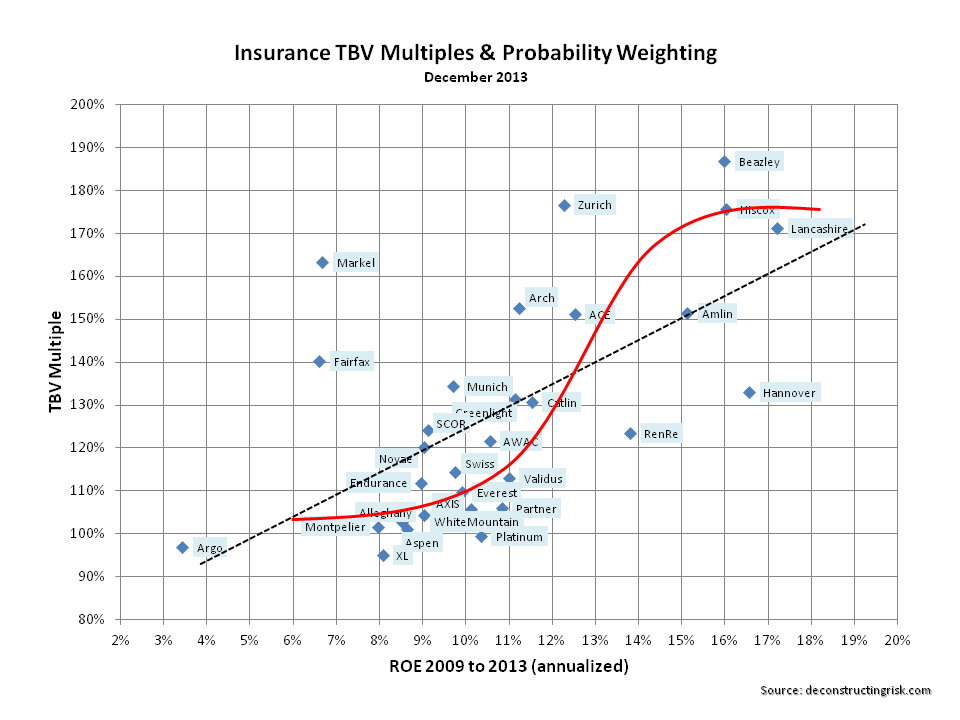
Based upon the proforma net tangible assets of Lancashire at end Q2 as per the Cathedral presentation and the circular for the share offering, the graph below shows the net tangible valuation multiples of a number of the London market insurers using net tangible asset values as at end Q2 with market values based upon todays’ closing prices.

click to enlargeLondon Market Specialty Insurers Net Tangible Book Multiples August 2013

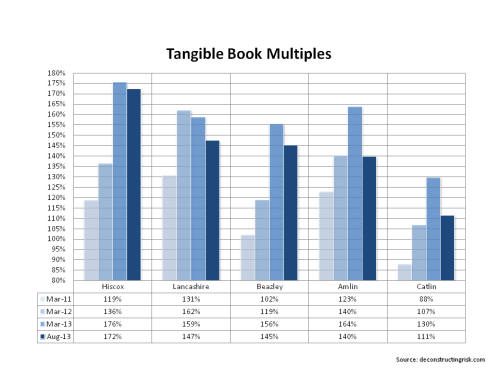
The multiples show that the market is now valuing Lancashire’s business at a level more akin to its peers rather than the premium valuation it previously enjoyed. Clearly, the acquisition of Cathedral raises questions over whether Lancashire will maintain its uniqueness in the future. That is certainly a concern. Also, integrating the firms and their cultures is an execution risk and heading into the peak of the US wind session could prove to be unwise timing.

Notwithstanding these issues, Brindle is an experienced operator and I would suspect that he is taking full advantage of the current arbitrage opportunities (as outlined in another post). It may take a quarter or two to fully understand the impact of the Cathedral acquisition on Lancashire’s risk/reward profile. I, for one, look forward to stalking the company to find an attractive entry point for increasing my position in anticipation of the return of Lancashire’s premium multiple.

Historical Price to Tangible Book Value for Reinsurers and Wholesale Insurers

Following on from the previous post, the graph below shows the historical P/TBV ratios for selected reinsurers and wholesale insurers with a portfolio including material books of reinsurance (company names as per previous post). The trend shows the recent uptick in valuations highlighted in the previous post. The graph is also consistent with the Guy Carpenter price to book value graph widely used in industry presentations.

Historical P to TBV Reinsurers & Wholesale Insurers 2001 to 2013Over the past 12 months the sector has broken out of the downward trend across the financial services sector following the financial crisis, most notably in the banking sector as the graph below from TT International illustrates.

TT International Bank Price to Book Ratio

Tangible book value growth across the wholesale insurance sector was approximately 10% from YE2011 to YE2012 and the weighted average operating ROE of 11% in 2012 has been rewarded with higher multiples.

The sector faces a number of significant issues and a return to valuations prior to the financial crisis remains unrealistic. An increase in capacity from non-traditional sources and the increased loss costs from catastrophes are cited in industry outlooks as headwinds although I tend to agree with EIOPA’s recently published risk dashboard in highlighting the impact of macro-economic risks on insurer’s balance sheets as the major headwind.

One issue that deserves further attention in this regard is the impact low interest rates have had on boasting unrealised gains and the resulting impact on the growth in book values. Swiss Re is one of the few companies to explicitly highlight the role of unrealised gains in its annual report, making up approximately 13% of its equity. In a presentation in September 2012, the company had an interesting slide on the impact of unrealised gains on the sector’s capital levels, reproduced below.

Reinsurer Capital & Unrealised Gains

P/TBV is one of my favoured metrics for looking at insurance valuations. But no one metric should be looked at in isolation. The impact of any sudden unwinding of unrealised gains if the macro environment turns nasty is just one of the issues facing the sector which deserves a deeper analysis.

Market valuations of wholesale insurers and reinsurers shift upwards

With many of the Bermudian, European and US wholesale insurers hitting 52 week highs last week, there is a definite shift in sentiment about the sector. It remains to be seen whether the shift is simply part of the overall market rally or a more structural shift in the markets view of the previously historic low tangible book multiples. A wide sample of firms in the reinsurance and wholesale insurance sectors are included in the graph below.

Wholesale Insurer & Reinsurer Valuations