
An interesting blog from PwC on the new European Solvency II regulatory regime for insurers commented that “analysts were optimistic about the level of detail they could expect from the Solvency II disclosures” and that it “was hoped that this would enable the volatility of cash generation and the fungibility of capital within a group to be better understood”.
The publication of insurer’s solvency ratios, under the Solvency II regulations to be introduced from next year, using the common mandated template called the standard formula is hoped to prove to be a good comparative measure for insurers across Europe. In the technical specifications for Solvency II (section 6 in this document), the implied credit ratings of the solvency ratios as calculated using the standard formula are shown below.
click to enlarge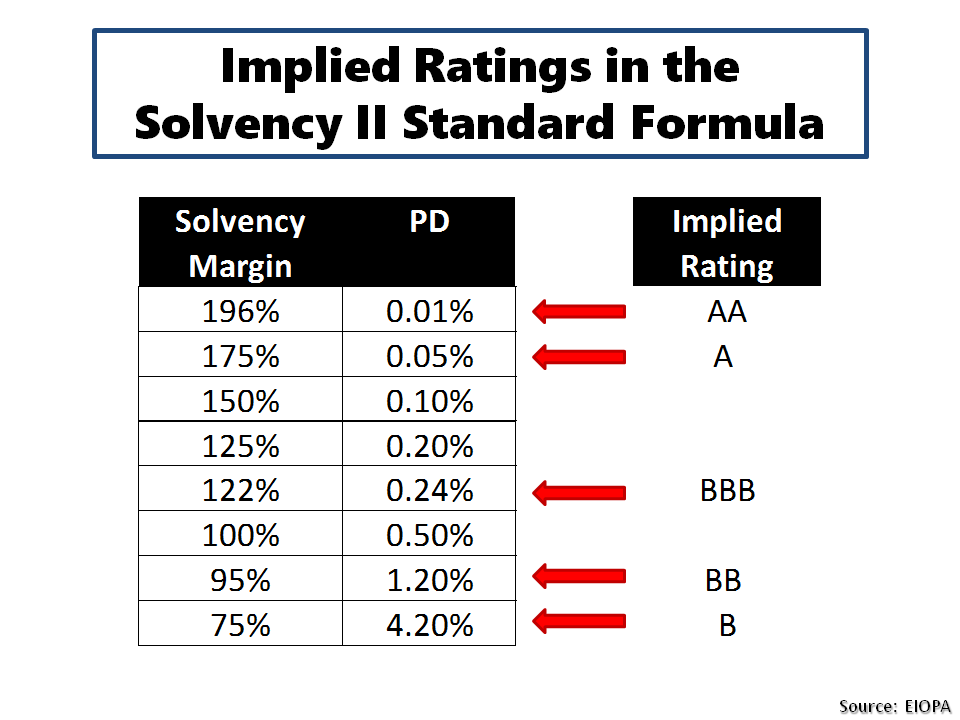
Firm specific internal models present a different challenge in comparing results as, by definition, there is no comment standard or template. The PwC blog states “the outcome of internal model applications remains uncertain in many jurisdictions and different national practices are emerging in implementing the long-term guarantee package including the transitional measures”. It’s therefore interesting to look at a number of Solvency II ratios published to date using insurer’s own models (or partial internal models) and compare them to their financial strength ratings (in this case S&P ratings), as per the graphic below.
click to enlarge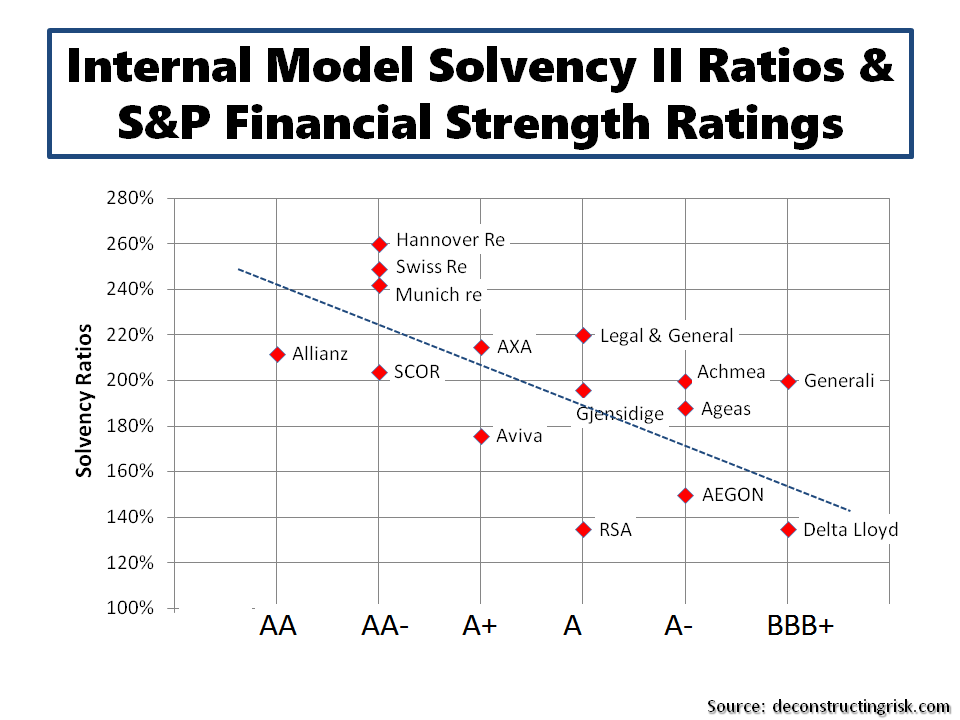
As firms start to publish their Solvency II ratios, whether under the standard formula or using an internal model, it will be interesting to see what useful insights for investors emerges. Or …..eh, based upon the above sample, otherwise.
