New valuation realities

As the market pulls back again this week in a much-needed dose of worry about where QE is leading us and how it will end, there is another interesting article from Buttonwood in this week’s Economist. Based upon work of analysts in investment banks BNP Paribas, Société Générale, and Goldman Sachs (Andrew Lapthorne of SG does high quality analysis and his work generally makes for insightful reading), the article highlights how valuations based upon price to book ratios have broken with pre-crisis history and currently differentiate more acutely between “quality” stocks (depending upon varying criteria as applied by the said analysts).

The article highlights the limited pool of “quality” stocks no-matter what criteria is used and Buttonwood also makes a point (which I fully agree with), namely that “investors have been flocking to equities because interest rates are so low; some, perhaps, on the naive view that using a lower discount rate on future cashflows translates into higher share prices today“.

As readers of this blog will be aware, two sectors that I follow are the wholesale insurance and the alternative telecom sectors. In previous posts, I have presented my historical valuation metrics for both sectors (albeit from limited samples) and they are combined in the graph below (one based upon price to tangible book, the other an EV/ebitda metric). The alternative telecom sector is as far away from any “quality” stock criteria that one could imagine and would be in the lowest quintile (on volatility alone!) of any sensible criteria. Although results are volatile by definition in the wholesale insurance sector, some of the bigger names like Munich Re may get higher ratings, maybe a 2 or 3 on Buttonwood’s graph.

click to enlarge

wholesale insurer & altnet valuation metric comparison

The main point I am trying to make in this post is that relying on valuations returning to levels prior to the financial crisis for certain sectors is just not realistic or sensible. Unless the market goes into fantasy land on the upside (this may seem idle speculation given the market’s current mood but just think where sentiment was a few short weeks ago), the differentiation currently been made in the market between business models and their inherent volatility is rational. The worry, as the article points out, is that there is not enough “quality” stocks around currently to wet the appetite of hungry investors and historically that has been a negative indicator for future stock returns.

Will it be different for Level3 this time?

As per my previous post on telecom experiences, I reviewed my projections and valuation methodology for Level3. Level3 has a frustrating yet fascinating past. It miraculously survived the telecom implosion with an over sized debt load through growing into its debt by buying up smaller metro focused telecoms and its most recent merger with a post chapter 11 Global Crossing.

Level 3 struggled with the integration of its numerous merger partners from 2005 to 2007 and, with the downturn in 2008 to 2010, suffered reductions in the both of the top and bottom lines of the combined entities. There is however now some hope that the integration with Global Crossing will not suffer the same fate. For a start, Level3 approached the integration with a much sharper focus on the customer experience during the merger and ensuring minimal service disruptions. Also, Global Crossing itself had a number of years following its restructuring where it focused on its core products and de-emphasised the low margin commodity business. Finally, the recent replacement of long time CEO Jim Crowe with the COO Jeff Storey seems to have brought a new focus in the company on growing the larger business organically rather than through continuous M&A.

I developed 3 scenarios to illustrate the benefits and the dangers of the current Level3 leveraged business model. The pessimistic scenario assumes that Level3 does not succeed in growing the top line and stumbles on achieving material ebitda margin improvement, only managing margins in the middle 20’s range. The base scenario assumes that Level3 does grow its higher margin business modestly (against a stodgy economic background with interest rates gradually stepping up over the medium term) which offsets reductions in voice based business, achieving an ebitda margin around 30% in the medium term. The optimistic scenario assumes Level3 gets on-going synergies and material ebitda margin improvement achieving a 33% margin by 2017 and thereafter. Graphs representing the scenarios are below and also show the resulting leverage ratios the business achieves.

LVLT Projection Pessimistic Scenario (click to enlarge)Level3 Pessimistic

LVLT Projection Base Scenario (click to enlarge)Level3 Base

LVLT Projection Optimistic Scenario (click to enlarge)Level3 Optimistic

The pessimistic scenario assumes that Level3 can’t get its leverage materially below 500% and would ultimately need to be restructured. Assuming the equity would be wiped out here may be conservative given the equity’s history to date at higher leverage levels. Also, a takeover may give the equity some value in this scenario. Notwithstanding these possibilities, the pessimistic scenario does illustrate the dangers to investing in a highly leveraged firm and given the current macro-economic headwinds and the likely higher interest rate environment to come, I believe an equity wipe-out remains a risk for Level3 in a pessimistic scenario.

The thin line between madness and sanity for highly leveraged firms is illustrated by the upside that modest and healthy growth of both bottom and top lines could result in the base and optimistic scenarios respectively. The following table shows the DCF results at discount rates ranging from 5% to 15%. The discounted cash-flow analysis assumes a termination multiple of discounted free cash-flow after 10 years in 2022 (different multiples for each scenario). As I stated in the previous telecom post, I take the results of a DCF analysis for these firms with a healthy pinch of salt given the timeframe involved and the number of assumptions that have to be made (e.g. cost of debt). Focussing on a discount rate of between 7.5% and 12.5% (which is where I think LVLT should be) does show that the leveraged business model of Level3 provides a 2 to 3 times upside against a 100% downside risk profile (assuming a current $21 per share price).

Summary of DCF Analysis (click to enlarge)

LVLT Share Price Upside & Downside

An alternative valuation method is to look at the EV/EBITDA multiple valuation that the scenarios above may imply. This analysis confirms a possible 200% to 300% upside for the base and optimistic scenarios respectively over a 5 year time horizon (and the 100% downside!).

EV/EBITDA Projection Pessimistic Scenario (click to enlarge)Level3 Pessimistic EV EBITDA multiple

EV/EBITDA Projection Base Scenario (click to enlarge)

LVLT EVtoEBITDA Project BASE

EV/EBITDA Projection Optimistic Scenario (click to enlarge)

LVLT EVtoEBITDA Project OPT

Conclusion

Level3 has broken many hearts in the past. However, if the new CEO can execute on organic growth and margin improvement, the stock offers an attractive upside over the next few years due to its leveraged balance sheet and operating model. A lack of macro-economic turmoil will also be an important factor in any success. For even more aggressive investors, playing the stock through long dated out of the money options offers the prospect of leveraging returns even further (with the accompanying increase in risk profile). As I keep stating, Level3 has promised much in the past and failed to deliver on a spectacular basis. This time, maybe, just maybe, it could deliver something for patient investors. Anybody considering Level3 should always keep in mind that it remains a high risk/return play and is not for the faint hearted.

Are equity markets in bubble territory?

With Friday’s selloff, it will be interesting to see if this week brings a pause to the equity run-up. The rise has been dramatic with most US indices up 12% to 14% this year and over 20% since the November lows. I was struck by the last market pause in May and the comments on the US business TV shows. One said that there was a wall of money on the sidelines waiting to buy on the dip. Institutional money desperate for yield and company’s filling buy back programmes do seem to provide this market with a floor.

Historical multiples such as the TTM PE and the PE 10 at 18.85 and 23.89 at the end of May for the Dow are high relative to the historical averages of 15.5 and 16.47 respectively. However given the flood of money printing at Central Banks around the world such levels are not surprising nor excessive. I don’t think we are in bubble territory yet but, given the lack of alternatives for money, we will likely end up there. Whether that takes another 6 or 12 or 24 months is not really important. In cases where risk premia is irrational, a quote from Jim Leitner in “The Invisible Hands” comes to mind where he advises that an investor should focus on “the possibility of buying cheap insurance when the market is willing to sell it, before the horse has left the barn“. It seems to me as this is such a time and I will be looking for such opportunities in the absence of a major pull back. In my mind, its better to spend some profit to give peace of mind whilst also participating in further run-ups.

Longer term, I am disturbed by the macro policies currently been pursued and the impact that an exit from QE may have. It makes little sense to respond to every crisis with loose monetary policy designed to reinflate asset values so that Western consumers can get back to the Mall. I thought our response was going to be more fundamental this time! On that subject, I noticed a review of a book in the Sundays – its called “When the money runs out, the end of western influence” by the HSBC economist Stephen King. The review was just okay although the Economist seems to have given it a better one. Cheery reading for the holidays!

ILS Pricing Party Heats Up

As we approach the July renewals, new capacity continues to pour into the insurance linked securities space pushing prices ever downward. Morgan Stanley estimate that so called alternative capital will make up 30% of the forthcoming July renewal. Market participants continue to cheer on the arrival of this capacity. To counter some of the concerns expressed about this market, some of which were outlined in my last post on this subject, I noticed an interesting article this week from Guy Carpenter’s website.

The article starts with an overview of the market stating “the impact has been dramatic; pricing has decreased more than 50 percent year over year, particularly for peak U.S. risks such as Florida”. And continues “the institutional money that is offering capacity to Florida wind at 40 percent less than last year’s pricing isn’t pricing Florida risk incorrectly, it just does not have the same capital costs and therefore can, on a sound basis, charge less for peak U.S. wind risk than the traditional reinsurance market on a sustained basis.

In other words, the return hurdles for institutional money is less! That doesn’t make sense if you consider the reduced diversification offered by investments in property catastrophe focused funds to institutional money compared to traditional reinsurers which have diversified portfolios spread over property, casualty, specialty and, in some cases, life business.

Guy Carpenter continue in their attempt to convince themselves that everything will be okay by stating that “increasing the breadth of an informed sophisticated investor base can only be a good thing for the markets’ long term prospects as it increases available capacity without leaving the market susceptible to reckless capital that will support transactions with ill-considered terms, which eventually cause problems themselves or set problematic precedents for others to follow.

I don’t really understand what they are saying here. Is it something as hollow as it’s okay to slash prices as they are “sophisticated investors”? I have even heard another broker try to justify the overall market benefit of the influx of capacity by concluding that excess capacity will result in more policyholders in the high risk zones being able to get property cover. I didn’t know that the institutional investors are getting into this asset class with the intent that the risk profiles expand! Where have we heard that before?

The article again states that “capacity is expanding because sophistication and attention to transaction mechanics is increasing, not decreasing.” Let’s look at a recent deal to see how that statement stacks up. One recent deal this month by Travelers, under the Long Point Re series, covering northeast US wind was priced as per the graphic below compared to last year.

Long Point Graph

Looking at a crude measure of risk and reward, as the coupon divided by expected loss, shows a ratio reduction from 741% to 345% for 2012 to 2013. Other recent deals also show reductions in the risk/reward dynamics such as the Turkish quake deal, under the Bosphorus Re banner, which got away for 250 basis points compared to an expected loss cost of 1% (that’s a 250% ratio). Industry veteran, Luca Albertini of ILS fund Leadenhall Capital Partners, remarked that the Turkish deal was significant as previously this market did not like to play in the sub-300 basis points deal area. Albertini put a positive spin on this development for his sector by saying that the new appetite for sub-300bps issuances means that a wider range of exposures and therefore deals can be marketed, thereby providing diversification. That sounds great but, to paraphrase a quote from Jim Leitner, is there any real benefit to diversification if such diversification comes from a portfolio of underpriced assets? Underpriced risk is, after all, mispriced risk.

I recently asked a banker, who has marketed this new asset class to clients, at what level of return would the institutional investors walk away. To my surprise he said none; based upon his previous experience of investors following sheep like into quant driven new “non-correlating” asset classes, only a loss would awaken investors to the risks. It’s depressing to think that institutional money still likes to partake in the practice of picking up pennies in front of a stream roller!

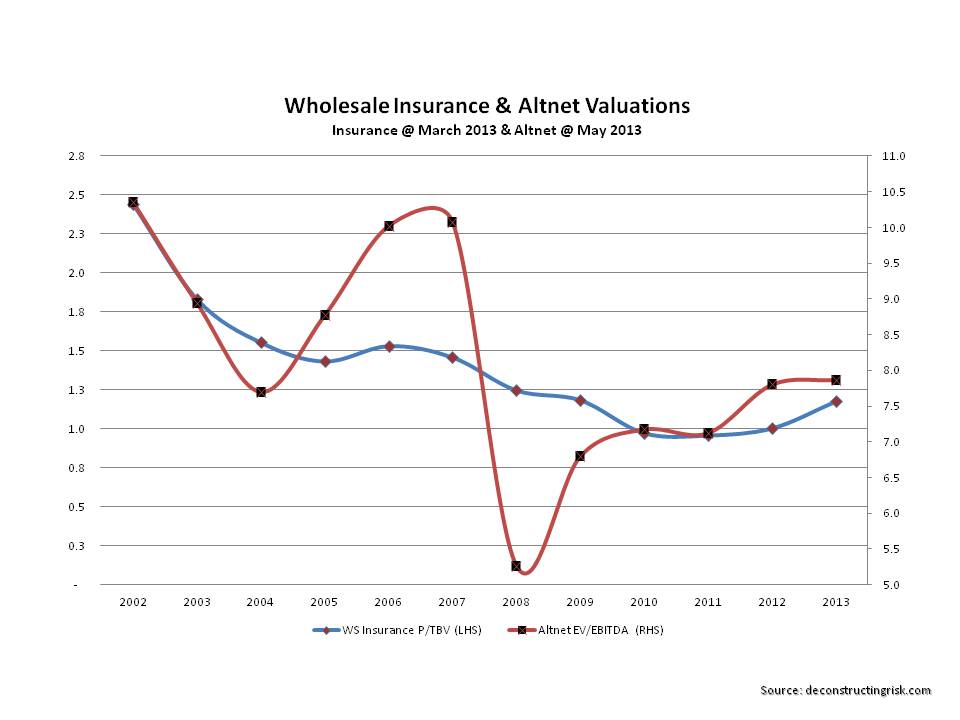
As readers will realise, I am becoming ever more cautious on the wholesale insurance & reinsurance sector. With overall demand decreasing and supply increasing, the sector looks like it’s reaching an inflection point. In the short term, returns will likely remain acceptable (high single/low double digit ROE) if claim inflation stays mute resulting in continuing underwriting profits/reserve releases and in the absence of large catastrophes. In the medium term, ILS pricing pressures and new capacity entering the traditional market (latest examples include new money from Qatar in the form of Q Re and the AON/Berkshire deal providing a 7.5% blind follow line across the Lloyds market) leads me to conclude that a more defensive investment strategy in this space is warranted.

Underwriting and Credit Cycle Circles

An article from Buttonwood in March reviewed a book by Thomas Aubrey – “Profiting from monetary policy – investing through the business cycle”. Aubrey argues that credit cycles are better predictors of equity and asset prices rather than economic growth. Differentials between the cost of capital and the return on capital drive capital supply.

In previous presentations on the insurance sector and the factors affecting underwriting cycles, I have used the credit cycle as an explanation for demand and supply imbalances. Given the current influx of yield seeking capital into the wholesale insurance market, by way of new risk transfer mechanisms in the ILS sector, and the irrational cost of capital driven by loose monetary policy around the world, Aubrey’s arguments make sense.

Using the calendar year combined ratios of the Lloyds of London insurance market as a proxy for the wholesale market, discounting such ratios at the risk free rate for each year with an assumed payout duration, and comparing these to an index of S&P defaults by origination year illustrates the relationship.

Underwriting & Credit CyclesThe more recent impact of natural catastrophes from 2005 and 2011 illustrates the higher concentration of shorter tail business lines in the past decade as interest rate reductions make longer tail lines less attractive.

Of course, no one factor drives the insurance cycle and there may be a degree of circularity in this picture. Many of the losses at Lloyds in the 1980s and 1990s came from asbestos and pollution claims, issues which drove many companies into insolvency. There is also a circularity between the insurance losses from the events of 9/11 and the economic impact following the bursting of the internet bubble. In addition, there are limitations in comparing calendar year ratios which includes reserve deterioration (particularly from asbestos years) against defaults by origination. Notwithstanding these items, it’s an interesting graph!