Tag Archives: Financial services

Piddling Productivity

Walk around any office today and you will likely see staff on the internet or playing with their smartphones, the extent of which will depend upon the office etiquette. The rise of the networked society would intuitively imply increased productivity. Data analytics, the cloud, the ease with which items can be researched and purchased all imply a rise in efficiency and productivity. Or does it?

Productivity is about “working smarter” rather than “working harder” and it reflects our ability to produce more output by better combining inputs, owing to new ideas, technological innovations and business models. Productivity is critical to future growth. Has the rise of social media, knowing what your friends favourite type of guacamole is, made any difference to productivity? The statistics from recent years indicate the answer is no with the slowdown in productivity vexing economists with a multitude of recent opinion and papers on the topic. Stanley Fisher from the Fed stating in an interesting speech for earlier this month that “we simply do not know what will happen to productivity growth” and included the graph below in his presentation.

click to enlargeUS Average Productivity Growth 1952 to 2015

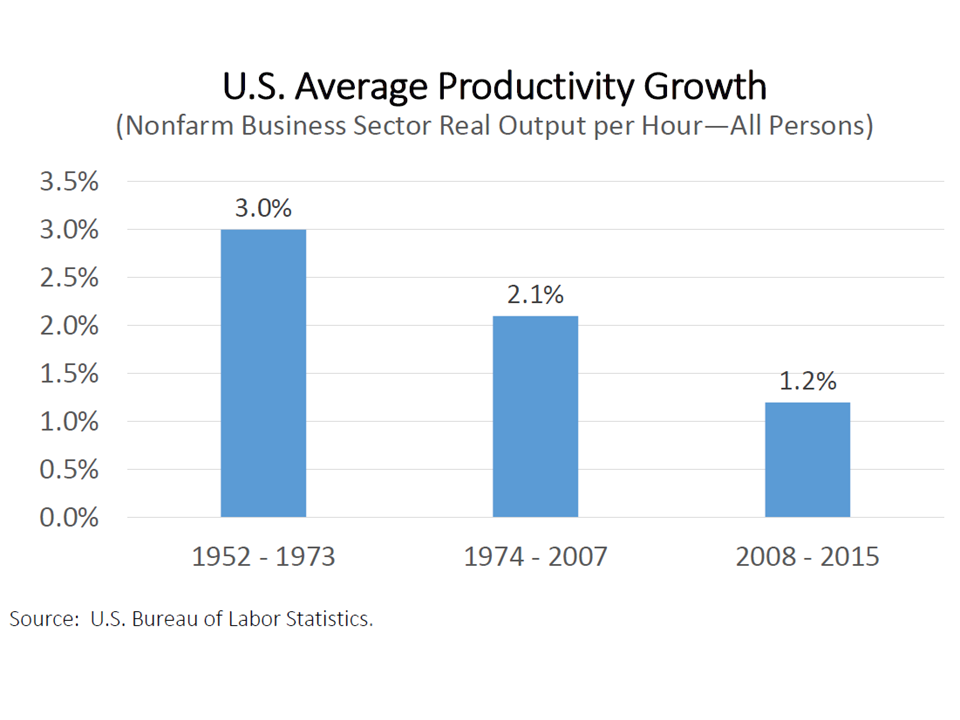
Martin Wolf in a piece in the FT on recent projections by the Office for Budget Responsibility (OBR) calls the prospects for productivity “the most important uncertainty affecting economic prospects of the British people”.

Some think the productivity statistics have misestimated growth and the impact of technology (e.g. the amount of free online services). A recent paper from earlier this month by Fed and IMF employees Byrne, Fernald and Reinsdorf concluded that “we find little evidence that the slowdown arises from growing mismeasurement of the gains from innovation in IT-related goods and services”.

The good news seems to be that productivity slumps are far from unprecedented according to a paper in September last year from Eichengreen, Park and Shin. The bad news is that the authors conclude the current slump is widespread and evident in advanced countries like the U.S. and UK as well as in emerging markets in Latin America, Southeast Europe and Central Asia including China.

A fascinating paper from December 2015 by staff at the Bank of England called “Secular drivers of the global real interest rate” covers a wide range of issues which are impacting growth, including productivity growth. I am still trying to digest much of the paper but it does highlight many of the economists’ arguments on productivity.

One of those is Robert Gordon, who has a new bestseller out called “The Rise and Fall of American Growth”. Gordon has long championed the view of a stagnation in technology advances due to structural headwinds such as an educational plateau, income inequality and public indebtedness.

click to enlargeAverage Annual Total Facor Productivity

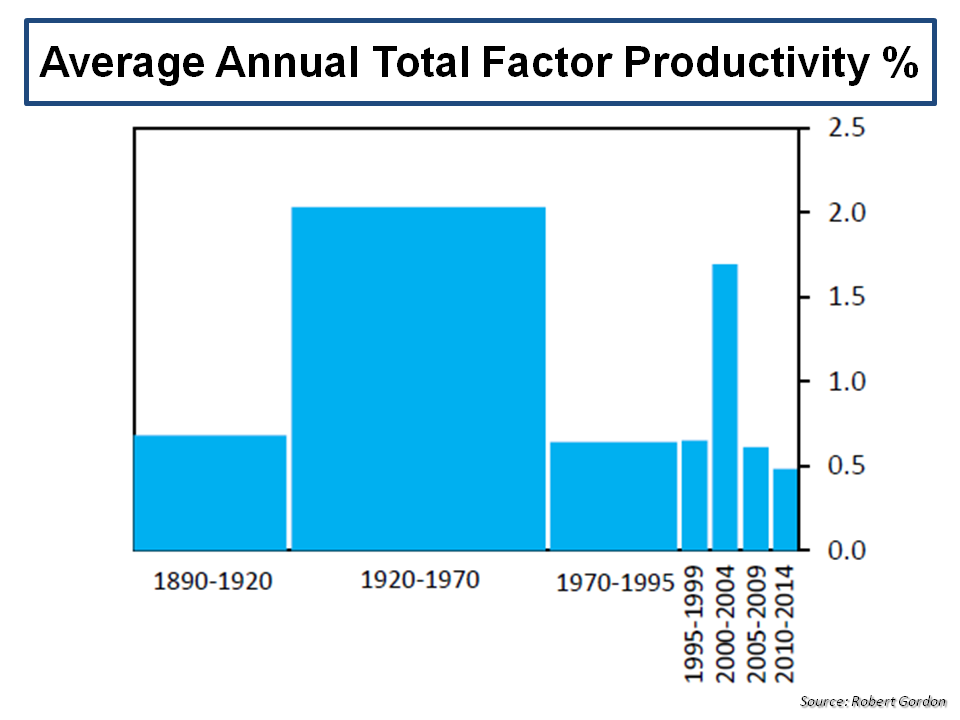
Others argue that productivity comes in waves and new technology often takes time to be fully integrated into the production process (e.g. electricity took 20 years before the benefits showed in labour productivity).

Clearly this is an important issue and one which deserves the current level of debate. Time will tell whether we are in a slump and will remain there or whether we are at the dawn of a golden era of innovation led productivity growth…..

Does financial innovation always end in reduced risk premia?

Quarterly reports from Willis Re and Aon Benfield highlight the impact on US catastrophe pricing from the new capital flowing into the insurance sector through insurance linked securities (ILS) and collaterised covers. Aon Benfield stated that “clients renewing significant capacity in the ILS market saw their risk adjusted pricing decrease by 25 to 70 percent for peak U.S. hurricane and earthquake exposed transactions” and that “if the financial management of severe catastrophe outcomes can be attained at multiple year terms well inside the cost of equity capital, then at the extreme, primary property growth in active zones could resume for companies previously restricting supply”.

This represents a worrying shift in the sector. Previously, ILS capacity was provided at rates at least equal to and often higher than that offered by the traditional market. The rationale for a higher price made sense as the cover provided was fully collaterized and offered insurers large slices of non-concentrated capacity on higher layers in their reinsurance programmes. The source of the shift is significant new capacity being provided by yield seeking investors lured in by uncorrelated returns. The Economist’s Buttonwood had an article recently entitled “Desperately seeking yield” highlighting that spreads on US investment grade corporate bonds have halved in the past 5 years to about 300bps currently. Buttonwood’s article included Bill Gross’s comment that “corporate credit and high-yield bonds are somewhat exuberantly and irrationally priced”. As a result, money managers are searching for asset classes with higher yields and, by magic, ILS offers a non-correlating asset class with superior yield.  Returns as per those from Eurekahedge on the artemis.bm website in the exhibit below highlight the attraction.

ILS Returns EurekahedgeSuch returns have been achieved on a limited capacity base with rationale CAT risk pricing. The influx of new capital means a larger base, now estimated at $35 billion of capacity up from approximately $5 billion in 2005, which is contributing to the downward risk pricing pressures under way. The impact is particularly been felt in US CAT risks as these are the exposures offering the highest rate on lines (ROL) globally and essential risks for any new ILS fund to own if returns in excess of 500 bps are to be achieved. The short term beneficiaries of the new capacity are firms like Citizens and Allstate who are getting collaterised cover at a reduced risk premium.

The irony in this situation is that these same money managers have in recent years shunned traditional wholesale insurers, including professional CAT focussed firms such as Montpelier Re, which traded at or below tangible book value. The increase in ILS capacity and the resulting reduction of risk premia will have a destabilising impact upon the risk diversification and therefore the risk profile of traditional insurers. Money managers, particularly pension funds, may have to pay for this new higher yielding uncorrelated asset class by taking a hit on their insurance equities down the road!

Financial innovation, yet again, may not result in an increase in the size of the pie, as originally envisaged, but rather mean more people chasing a smaller “mispriced” pie. Sound familiar? When thinking of the vast under-pricing of risk that the theoretical maths driven securitisation innovations led to in the mortgage market, the wise words of the Buffet come to mind – “If you have bad mortgages….they do not become better by repackaging them”. Hopefully the insurance sector will avoid those mistakes!

Historical Price to Tangible Book Value for Reinsurers and Wholesale Insurers

Following on from the previous post, the graph below shows the historical P/TBV ratios for selected reinsurers and wholesale insurers with a portfolio including material books of reinsurance (company names as per previous post). The trend shows the recent uptick in valuations highlighted in the previous post. The graph is also consistent with the Guy Carpenter price to book value graph widely used in industry presentations.

Historical P to TBV Reinsurers & Wholesale Insurers 2001 to 2013Over the past 12 months the sector has broken out of the downward trend across the financial services sector following the financial crisis, most notably in the banking sector as the graph below from TT International illustrates.

TT International Bank Price to Book Ratio

Tangible book value growth across the wholesale insurance sector was approximately 10% from YE2011 to YE2012 and the weighted average operating ROE of 11% in 2012 has been rewarded with higher multiples.

The sector faces a number of significant issues and a return to valuations prior to the financial crisis remains unrealistic. An increase in capacity from non-traditional sources and the increased loss costs from catastrophes are cited in industry outlooks as headwinds although I tend to agree with EIOPA’s recently published risk dashboard in highlighting the impact of macro-economic risks on insurer’s balance sheets as the major headwind.

One issue that deserves further attention in this regard is the impact low interest rates have had on boasting unrealised gains and the resulting impact on the growth in book values. Swiss Re is one of the few companies to explicitly highlight the role of unrealised gains in its annual report, making up approximately 13% of its equity. In a presentation in September 2012, the company had an interesting slide on the impact of unrealised gains on the sector’s capital levels, reproduced below.

Reinsurer Capital & Unrealised Gains

P/TBV is one of my favoured metrics for looking at insurance valuations. But no one metric should be looked at in isolation. The impact of any sudden unwinding of unrealised gains if the macro environment turns nasty is just one of the issues facing the sector which deserves a deeper analysis.