
Following up on a previous post, Level 3 Communications (LVLT) has had a good run since June, breaking out of its trading range and holding around $30. Over the past 2 years, a successful trading strategy on LVLT would have been buying around $20 and selling in the high twenties, so I would expect traders of LVLT to take some profits (also there may be more shares on the market towards the end of the month after LVLT recently called some convertible debt). Given the historical volatility in LVLT and the market high valuations, a pull-back seems inevitable in the short term although over the medium term I have an increasing conviction that the future for LVLT’s long suffering equity holders is bright.
click to enlarge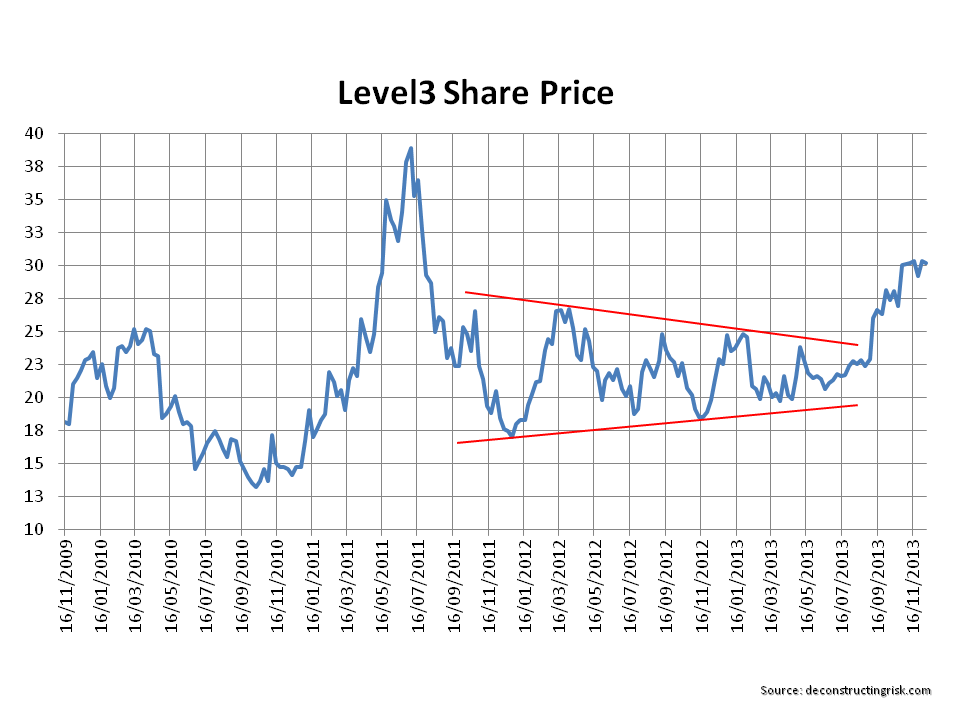
The recent increase has been driven by improving operating metrics, as per the graph on revenues and EBITDA margin below, and improved valuation multiples in the sector, as can be seen from a graphic on telecomrambings, plus the general increase in market valuations.
click to enlarge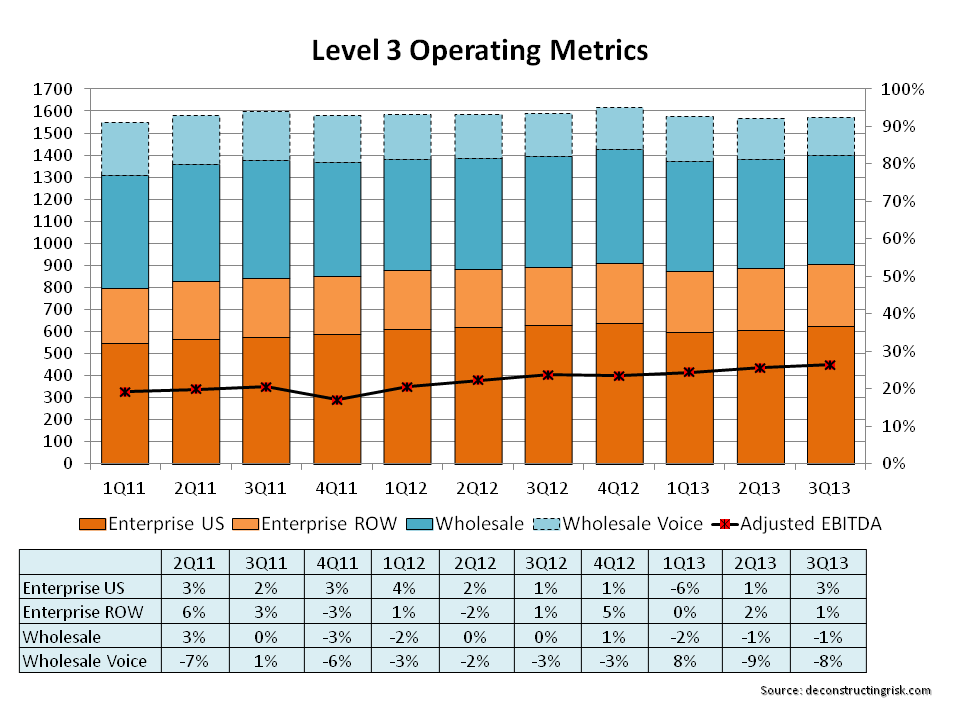
LVLT has also been working hard on getting its oversized debt load (as at Q3 net debt was approx $8 billion) down to a more manageable size. To date in Q4, the firm managed to refinance approx $1 billion of debt and convert another $200 million. As LVLT achieves sustainable FCF in 2014, a virtuous circle of increased operating margins and reduced debt servicing may follow, vastly improving the credit profile of this once basket case (credit risk wise). The debt tinkering should reduce the average interest rate by 30 bps to 6.9% for year end and, assuming 2014 EBITDA of $1.8 billion, will reduce the net debt to EBITDA multiple from the current 5.2 to a more manageable 4.4.
The analysts have all increased their targets on the back of the recent results under the new leadership of Jeff Storey. UBS AG, Canaccord and DA Davidson are at $30, Goldman Sachs has $34, Cowen has $39, Deutsche Bank is at $40 (although this includes $8 of NOLs).
It’s important to again stress that LVLT has a very volatile history and is not for the weak hearted. YahooFinance calculates the current beta for LVLT at 1.8. The graph below illustrates historical weekly volatility versus the S&P500. There is also an analysis of the relationship between the S&P500 and LVLT since 2009 – LVLT moved with the market 66% of the time (3.2 times on average the market move on the way up and 2.7 times on the way down!), 22% of the time when the S&P was up LVLT was down (by a factor of 3!), and 12% of the time when the S&P was down LVLT was up (by a factor of 6.5!).
click to enlarge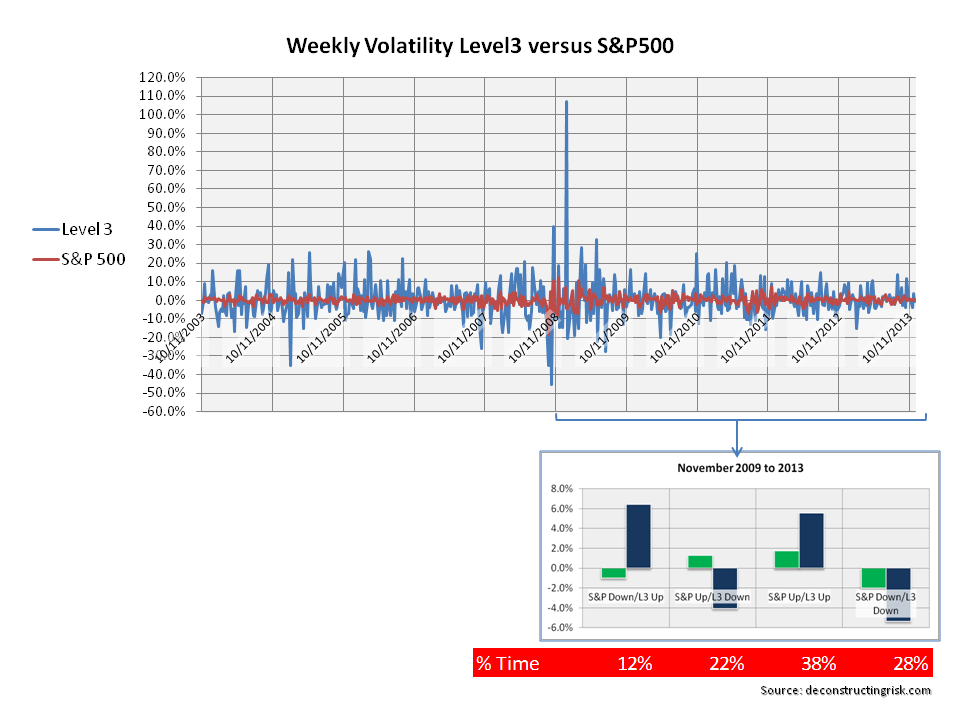
In an update of the highly influential paper by Andrea Frazzini and Lasse Pedersen called “Betting against Beta”, the authors test a number of investing strategies around beta and state that ”we find empirically that portfolios of high-beta assets have lower alphas and Sharpe ratios than portfolios of low-beta assets”. Although I would caution about short term volatility and an overexcited US equity market currently, I am hopeful that the days of LVLT being a pin-up for the high beta side are numbered.
