Monthly Archives: March 2015

Thoughts on ILS Pricing

Valuations in the specialty insurance and reinsurance sector have been given a bump up with all of the M&A activity and the on-going speculation about who will be next. The Artemis website reported this week that Deutsche Bank believe the market is not differentiating enough between firms and that even with a lower cost of capital some are over-valued, particularly when lower market prices and the relaxation in terms and conditions are taken into account. Although subject to hyperbole, industry veteran John Charman now running Endurance, stated in a recent interview that market conditions in reinsurance are the most “brutal” he has seen in his 44 year career.

One interesting development is the re-emergence of Richard Brindle with a new hybrid hedge fund type $2 billion firm, as per this Bloomberg article. Given the money Brindle made out of Lancashire, I am surprised that he is coming back with a business plan that looks more like a jump onto the convergence hedge fund reinsurer band wagon than anything more substantive given current market conditions. Maybe he has nothing to lose and is bored! It will be interesting to see how that one develops.

There have been noises coming out of the market that insurance linked securities (ILS) pricing has reached a floor. Given that the Florida wind exposure is ground zero for the ILS market, I had a look through some of the deals on the Artemis website, to see what pricing was like. The graph below does only have a small number of data points covering different deal structures so any conclusions have to be tempered. Nonetheless, it does suggest that rate reductions are at least slowing in 2015.

click to enlargeFlorida ILS Pricing

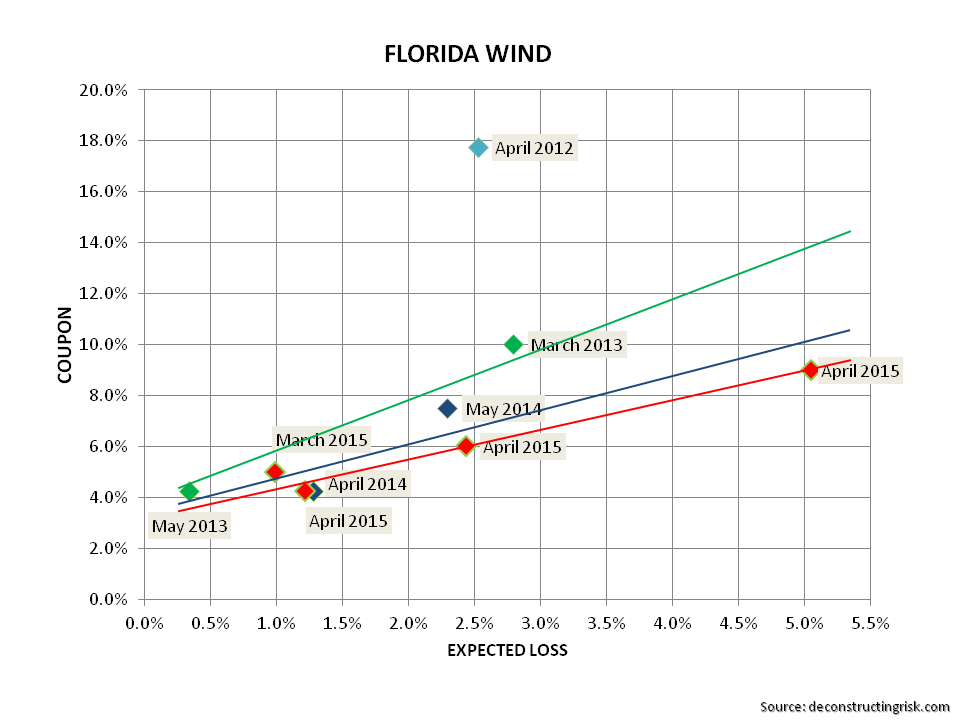
Any review of ILS pricing, particularly for US wind perils, should be seen in the context of a run of low storm recent activity in the US for category 3 or above. In their Q3-2014 call, Renaissance Re commented (as Eddie pointed out in the comments to this post) that the probability of a category 3 or above not making landfall in the past 9 years is statistically at a level below 1%. The graph below shows some wind and earthquake pricing by vintage (the quake deals tend to be the lower priced ones).

click to enlargeWind & Quake ILS Pricing by year

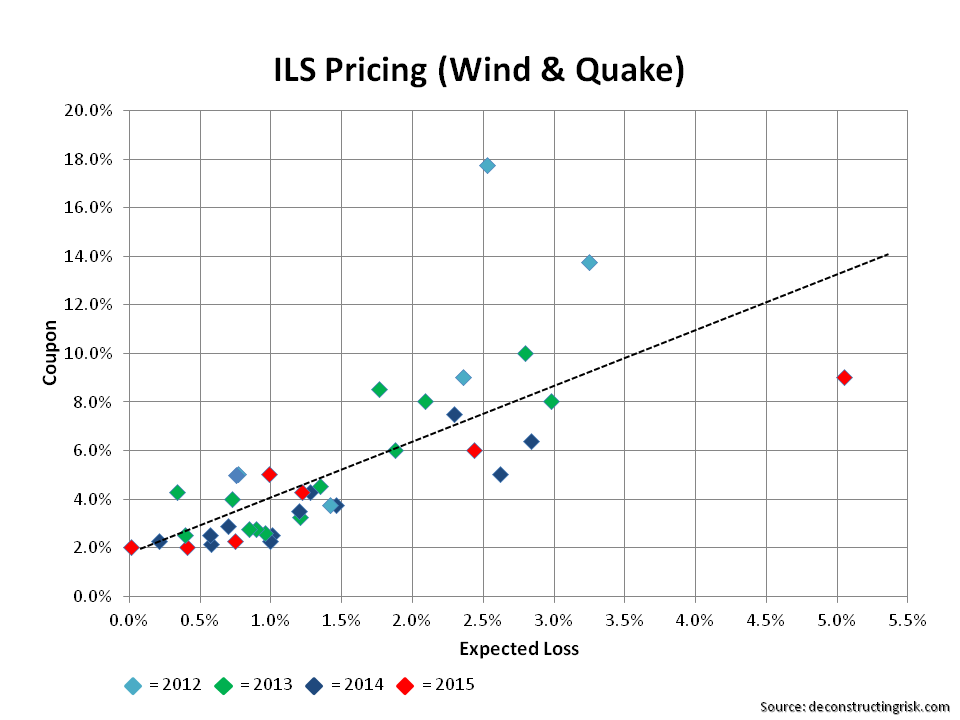
This graph does suggest that a floor has been reached but doesn’t exactly inspire any massive confidence that pricing in recent deals is any more adequate than that achieved in 2014.

From looking through the statistics on the Artemis website, I thought that a comparison to corporate bond spreads would be interesting. In general (and again generalities temper the validity of conclusions), ILS public catastrophe bonds are rated around BB so I compared the historical spreads of BB corporate against the average ILS spreads, as per the graph below.

click to enlargeILS Spreads vrs BB Corporate Spread

The graph shows that the spreads are moving in the same direction in the current environment. Of course, it’s important to remember that the price of risk is cheap across many asset classes as a direct result of the current monetary policy across the developed world of stimulating economic activity through encouraging risk taking.

Comparing spreads in themselves has its limitation as the underlying exposure in the deals is also changing. Artemis uses a metric for ILS that divides the spread by the expected loss, referred to herein as the ILS multiple. The expected loss in ILS deals is based upon the catastrophe modeller’s catalogue of hurricane and earthquake events which are closely aligned to the historical data of known events. To get a similar statistic to the ILS multiple for corporate bonds, I divided the BB spreads by the 20 year average of historical default rates from 1995 to 2014 for BB corporate risks. The historical multiples are in the graph below.

click to enlargeILS vrs BB Corporate Multiples

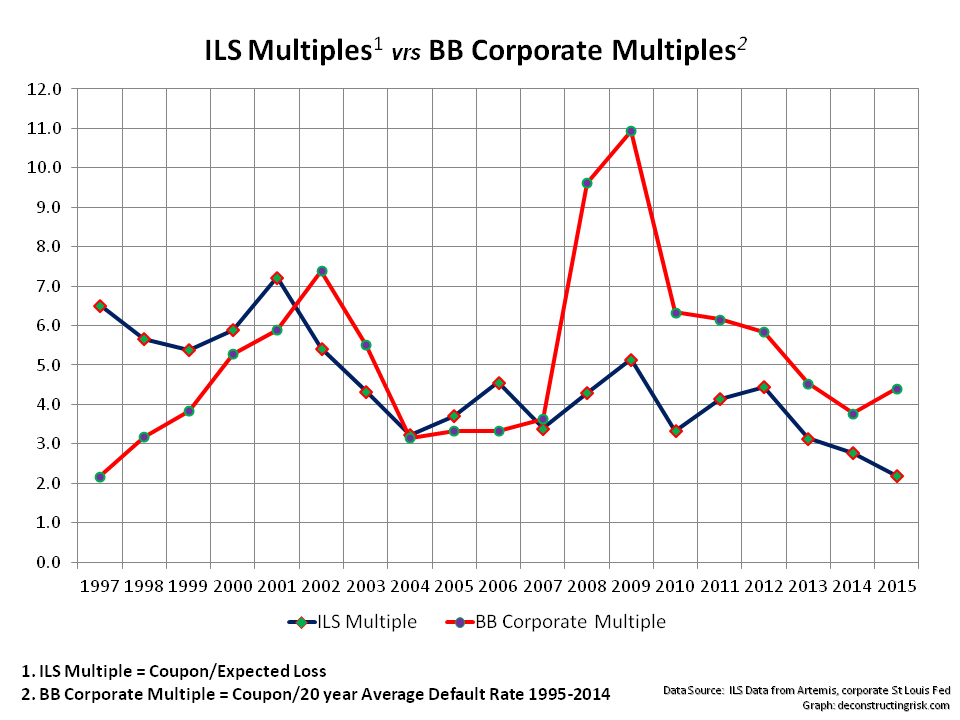
Accepting that any conclusions from the graph above needs to consider the assumptions made and their limitations, the trends in multiples suggests that investors risk appetite in the ILS space is now more aggressive than that in the corporate bond space. Now that’s a frightening thought.

Cheap risk premia never ends well and no fancy new hybrid business model can get around that reality.

Follow-up: Lane Financial LLC has a sector report out with some interesting statistics. One comment that catch my eye is that they estimate a well spread portfolio by a property catastrophic reinsurer who holds capital at a 1-in-100 and a 1-in-250 level would only achieve a ROE of 8% and 6.8% respectively at todays ILS prices compared to a ROE of 18% and 13.3% in 2012. They question “the sustainability of the independent catastrophe reinsurer” in this pricing environment and offer it as an explanation “why we have begun to see mergers and acquisitions, not between two pure catastrophe reinsurers but with cat writers partnering with multi-lines writers“.

Cyber Insurance Catastrophe Scenario

The UK government and Marsh released an interesting report today on cyber risk and insurance. Most cyber insurance is written on a standalone basis or as an add-on to professional indemnity, D&O, general liability or business interruption and property covers. Policy wording and terms and conditions vary widely. One of the current uncertainties is what will happen when a major attack, or more likely a frequency of industry wide cyber attacks, occurs and how traditional insurance exclusions will hold up in the case of legal challenge. The recent 2014 ruling on the Sony Playstation’s 2011 data breach provided the insurance industry comfort that they will stand up but nothing is certain when new types of losses unforeseen by existing policy wordings meet the US legal system.

The report relieves some interesting facts on the market such as the quantum and variability of current pricing for cyber insurance, as the paragraph and graphic below show.

“There are several factors that influence the price of different insurance products. In the case of cyber insurance, the price may also be driven by uncertainty over the risk compared to more traditional covers. This seems to be the case, with much flatter pricing for cyber across firms than for other lines of insurance; the difference between third and first quartile pricing is 1.7x for cyber, 9.1x for general liability, and 2.6x for property. The combination of a higher absolute price and lower price differentiation suggests that cyber is early in its development and that underwriters are more conservative about the risk, creating a challenge to a core role of insurance – namely, that high pricing discourages take up, and flat pricing provides no incentive for firms to reduce their cyber risk and save on premiums.”

click to enlarge2014 Cyber Insurance Market Pricing

On the topic of a probable maximum loss (PML) for the insurance sector, the report uses a fairly unscientific 20% of the estimated 2014 aggregate limit of £100 billion, based upon industry expert judgment, as a guesstimate.

click to enlargeCyber Catastrophe Scenario

Given the need for insurers to diversify their product offerings in this soft specialty insurance market, future demand for cyber insurance products (the report says the cyber insurance market will grow threefold over the next 3 to 5 years) will mean that more accurate estimates for risk accumulations need to be developed.

At this stage in the product cycle for cyber insurance, most insurers can likely rely on their friendly and premium hungry reinsurer to take the aggregation risk from their cyber exposures (estimated by the report to be £20 billion). Given the capital markets risk appetite for low yields and insurance risks, it would not surprise me if some investment bank is currently busily working away on the first cyber bond!

Growing Alternate Lending Market

Over a year ago, I posted on an IOSCO report on the small but growing crowd-funding and P2P lending market. The University of Cambridge and EY issued a report last month which highlighted the growth in the sector putting its size at €3 billion in 2014 and predicting a growth to over €7 billion in 2015.

The UK is the largest market by far with about 75% of the deals originating from there, as the graph below from the report shows.

An interesting market, one worth keeping an eye on.

click to enlargeEuropean Alternative Financing Size

Level3 flying high

It has been over 6 months since I have posted on the prospects for the telecommunications firm Level3 (LVLT) following its merger with TW Telecom (TWTC). I had previously posted on the strength of TW Telecom’s business model and its admirable operating history so I am extremely positive on the combination. At the time of the last post, LVLT was trading around $45 a share, a five year high. Since that time, the stock fell to a low of $38 in October 2014 before reaching a new high in recent weeks around $54.

My previous post, using figures disclosed in a S-4 filing on the merger negotiations, made a projection that the combined entity could get to $9 billion of revenue and $3 billion of EBITDA by 2016. Based upon the Q4 figures, the firm’s guidance, and the recently filed 10K, I did some more detailed figures and now estimate that the $9B/$3B revenue/EBITDA threshold will more likely be in 2017 rather than 2016. My estimates for each against the consensus from analysts are below.

click to enlargeLevel3 Revenues and EBITDA estimates 2015 to 2017

LVLT is an acquisitive firm and has learned through multiple deals the optimal way of integrating new firms through a shape focus on the customer experience whilst prudently integrating operations and reducing costs. Taking the Global Crossing integration as a template, the graphic below illustrates how my estimates fit in the past.

click to enlargeLevel3 Operating Metrics 2005 to 2015

So, the question now is whether a share price in the mid to high 50s is justified (the average consensus is around $57 with the highest being Canaccord’s recent target of $63). Using an enterprise value to EBITDA multiple based upon a forward 12 month EBITDA figures (actual where relevant and my estimates from Q1-2015), I think a target between $50 and $60 is justified assuming a forward multiple of 10 to reflect growth prospects, as the graphic below illustrates. My DCF analysis also supports a target in the low 60s.

click to enlargeLevel3 10year EVtoEBITDA versus Share Price

Such a target range assumes operating results show positive momentum and that the overall market remains relatively stable with expectations on interest rate increases in the US within current estimates. Due to LVLT’s net debt load of just under $11 billion and a proforma leverage ratio of 4.4 to EBITDA, the stock is historically exposed to macro-economic volatility. A mitigant against such volatility is the increasing level of free cash that the business will generate (I estimate $600/$900/ $1,000 million over 2015 to 2017). Also, about $6.5 billion of its debt is fixed (current blended rate is 7.2%) and LVLT’s CFO has shown considerable skill in recent years at managing the interest rate down in this yield hungry environment. Its remaining floating debt (blended rate of 4.2%) has a minimum LIBOR rate of 1% and therefore offers headroom against movements in current LIBOR rates

In my view, the key in terms of valuation is that the integration goes smoothly and that revenue growth in the enterprise market is maintained. One of the principal reasons for my optimism on LVLT is the operational leverage the business has as the mix of its business moves more towards the higher margin and stickier enterprise market, as the pro-forma revenue split shows.

click to enlargeLevel3 Proforma Revenue Split

As always with LVLT, I recommend using options to protect downside and waiting for a pull-back from current highs for any new investment. This stock has historically not been one for the faint hearted. I do believe however that they are on the path to a more stable future and it remains a core holding for me.