Category Archives: Insurance Models

Tails of VaR

In an opinion piece in the FT in 2008, Alan Greenspan stated that any risk model is “an abstraction from the full detail of the real world”. He talked about never being able to anticipate discontinuities in financial markets, unknown unknowns if you like. It is therefore depressing to see articles talk about the “VaR shock” that resulted in the Swissie from the decision of the Swiss National Bank (SNB) to lift the cap on its FX rate on the 15th of January (examples here from the Economist and here in the FTAlphaVille). If traders and banks are parameterising their models from periods of unrepresentative low volatility or from periods when artificial central bank caps are in place, then I worry that they are not even adequately considering known unknowns, let alone unknown unknowns. Have we learned nothing?

Of course, anybody with a brain knows (that excludes traders and bankers then!) of the weaknesses in the value-at-risk measure so beloved in modern risk management (see Nassim Taleb and Barry Schachter quotes from the mid 1990s on Quotes page). I tend to agree with David Einhorn when, in 2008, he compared the metric as being like “an airbag that works all the time, except when you have a car accident“.  A piece in the New York Times by Joe Nocera from 2009 is worth a read to remind oneself of the sad topic.

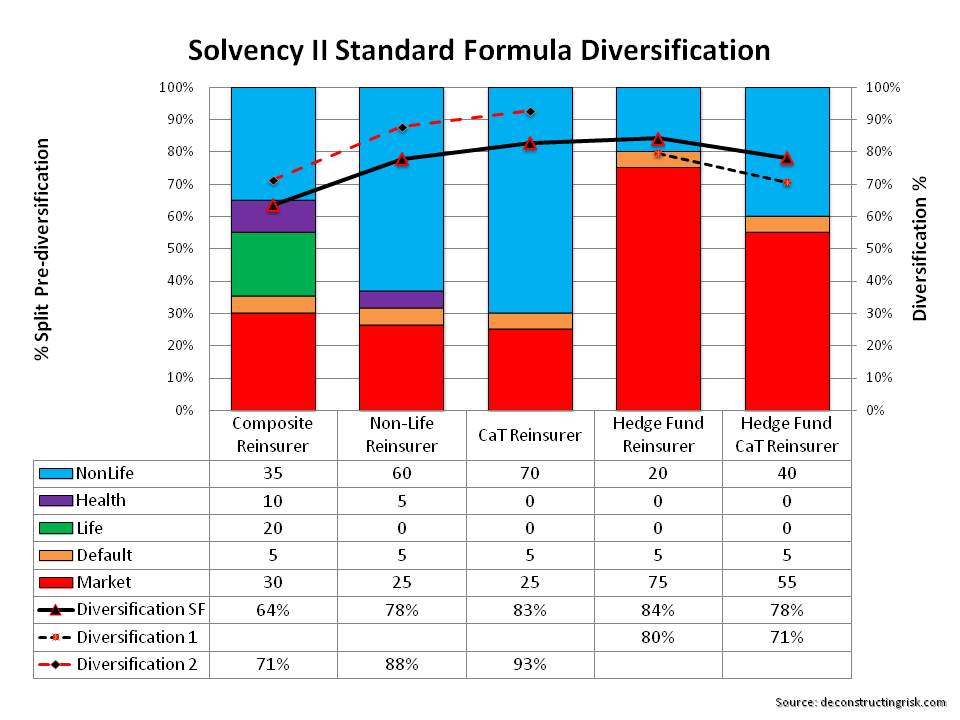
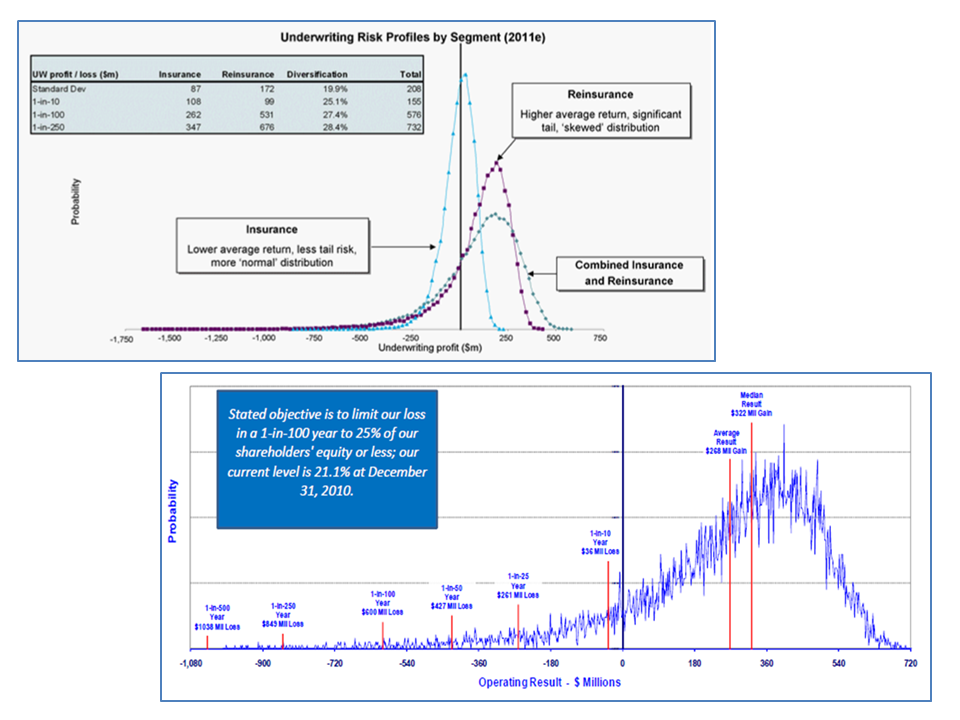
This brings me to the insurance sector. European insurance regulation is moving rapidly towards risk based capital with VaR and T-VaR at its heart. Solvency II calibrates capital at 99.5% VaR whilst the Swiss Solvency Test is at 99% T-VaR (which is approximately equal to 99.5%VaR). The specialty insurance and reinsurance sector is currently going through a frenzy of deals due to pricing and over-capitalisation pressures. The recently announced Partner/AXIS deal follows hot on the heels of XL/Catlin and RenRe/Platinum merger announcements. Indeed, it’s beginning to look like the closing hours of a swinger’s party with a grab for the bowl of keys! Despite the trend being unattractive to investors, it highlights the need to take out capacity and overhead expenses for the sector.

I have posted previously on the impact of reduced pricing on risk profiles, shifting and fattening distributions. The graphic below is the result of an exercise in trying to reflect where I think the market is going for some businesses in the market today. Taking previously published distributions (as per this post), I estimated a “base” profile (I prefer them with profits and losses left to right) of a phantom specialty re/insurer. To illustrate the impact of the current market conditions, I then fattened the tail to account for the dilution of terms and conditions (effectively reducing risk adjusted premia further without having a visible impact on profits in a low loss environment). I also added risks outside of the 99.5%VaR/99%T-VaR regulatory levels whilst increasing the profit profile to reflect an increase in risk appetite to reflect pressures to maintain target profits. This resulted in a decrease in expected profit of approx. 20% and an increase in the 99.5%VaR and 99.5%T-VaR of 45% and 50% respectively. The impact on ROEs (being expected profit divided by capital at 99.5%VaR or T-VaR) shows that a headline 15% can quickly deteriorate to a 7-8% due to loosening of T&Cs and the addition of some tail risk.

click to enlargeTails of VaR

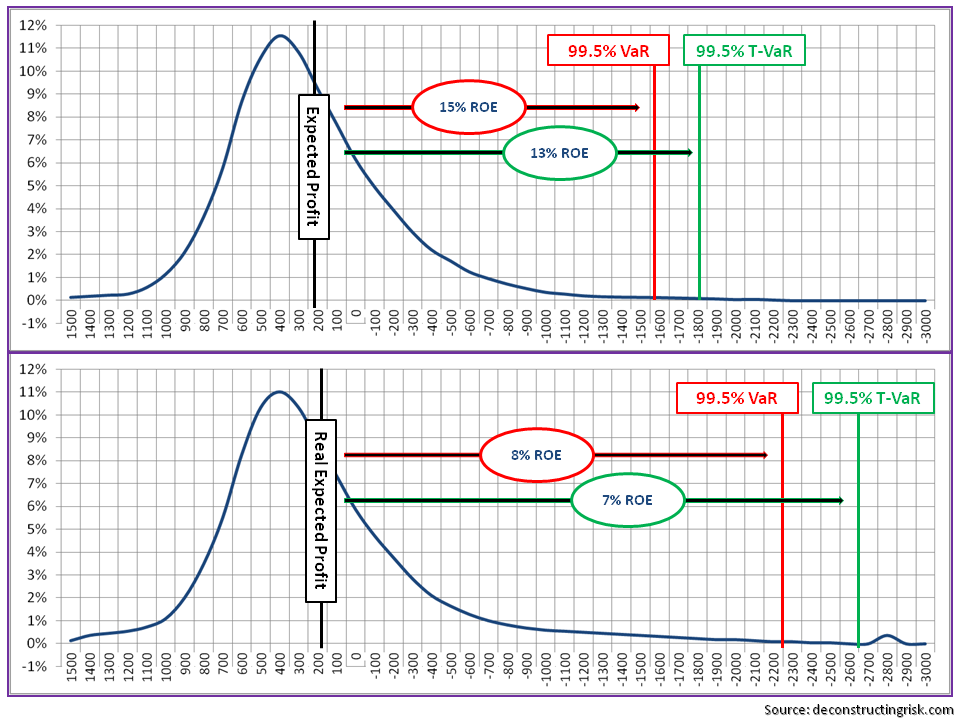
For what it is worth, T-VaR (despite its shortfalls) is my preferred metric over VaR given its relative superior measurement of tail risk and the 99.5%T-VaR is where I would prefer to analyse firms to take account of accumulating downside risks.

The above exercise reflects where I suspect the market is headed through 2015 and into 2016 (more risky profiles, lower operating ROEs). As Solvency II will come in from 2016, introducing the deeply flawed VaR metric at this stage in the market may prove to be inappropriate timing, especially if too much reliance is placed upon VaR models by investors and regulators. The “full detail of the real world” today and in the future is where the focus of such stakeholders should be, with much less emphasis on what the models, calibrated on what came before, say.

Mega-Tsunami Fright Scenario

There was a nice piece on the online FT on the forces impacting the reinsurance sector last night. Lancashire, which is behaving oddly these days, was one of the firms mentioned. Lancashire looks like its set to drop by approximately 12% (the amount of the special dividend) when it goes ex-dividend after today the 28th (although yahoo has been shown it dropping by 10%-12% at the end of trading for several days now, including yesterday). If it does drop to a £5.50 level, that’s approximately a 123% price to diluted tangible book value. Quite a come down from the loftier valuations of 150%-170% under previous CEO Richard Brindle!

Anyway, this post is not about that. A major part of modern risk management in the insurance sector today is applying real life scenarios to risk portfolios to assess their impact. Lloyds’ has being doing it for years with their realistic disaster scenarios (RDS). Insurers are adept at using scenarios generating by professional catastrophic models from firms like RMS and AIR on so-called peak zones like US hurricanes or Japan earthquake. Many non-peak scenarios are not explicitly modelled by such firms.

The horrors of the tsunamis from the 2011 Tōhoku and the 2004 Indian Ocean earthquakes have been brought home vividly in this multi-media age. The damage in human terms from the receding waters full of debris makes the realities of such events all too real.  Approximately 80% of tsunamis come from earthquakes and history is littered with examples of large destructive tsunami resulting from earthquakes – the 1755 Great Lisbon earthquake in Portugal, the 1783 Calabrian and the 1908 Messina earthquakes in Italy, the 1896 Sanriku earthquake in Japan, the recently discovered 365 AD Mediterranean quake, the 1700 Cascadia Megathrust earthquake in the west coast of the US, and the 1958 Lituya Bay quake in Alaska are but a few examples.

Volcanoes are another potential cause of mega tsunamis as many volcanoes are found next to the sea, notably in countries bordering the Pacific Ocean, the northern Mediterranean and the Caribbean Sea.  One scenario put forward by a paper from Steven Ward and Simon Day in 2001 is the possibility of a mega tsunami from a collapse of an unstable volcanic ridge caused by previous Cumbre Vieja volcanoes in 1949 and 1971 in La Palma in the Canary Islands. The threat was has been dramatically brought to life by a 2013 BBC Horizon programme called “Could We Survive A Mega-Tsunami?”. Unfortunately I could not find a link to the full programme but a taster can be found here.

The documentary detailed a scenario where a future eruption could cause a massive landslide of 500 km3 of rock crashing into the sea, causing multiple waves that would travel across the Atlantic Ocean and devastate major cities along the US east coast, as well as parts of Africa, Europe and southern England & Ireland. The damage would be unimaginable, causing over 4 million deaths and economic losses of over $800 billion. The impact of the damage on port and transport infrastructure would also result in horrible after event obstacles to rescue and recovery efforts.

The possibility of such a massive landslide resulting from a La Palma volcano has been disputed by many scientists. In 2006, Dutch scientists released research which stipulated that the south west flank of the island was stable and unlikely to fall into the sea for at least another 10,000 years. More recent research in 2013, has shown that 8 historical landslides associated with volcanoes in the Canary Islands have been staggered in discrete landslides and that the likelihood of one large 500 km3 landslide is therefore extremely remote. The report states:

“This has significant implications for geohazard assessments, as multistage failures reduce the magnitude of the associated tsunami. The multistage failure mechanism reduces individual landslide volumes from up to 350 km3 to less than 100 km3. Thus although multistage failure ultimately reduce the potential landslide and tsunami threat, the landslide events may still generate significant tsunamis close to source.”

Another graph from the research shows that timeframe over which such events should be viewed is in the thousands of years.

click to enlargeHistorical Volcanic & Landslide Activity Canary Islands

Whatever about the feasibility of the events dramatised in the BBC documentary, the scientists behind the latest research do highlight the difference between probability of occurrence and impact upon occurrence.

“Although the probability of a large-volume Canary Island flank collapse occurring is potentially low, this does not necessarily mean that the risk is low. Risk is dependent both on probability of occurrence and the resultant consequences of such events, namely generation of a tsunami(s). Therefore, determining landslide characteristics of past events will ultimately better inform tsunami modelling and risk assessments.”

And, after all, that’s what good risk management should be all about. Tsunami are caused by large infrequent events so, as with all natural catastrophes, we should be wary that historical event catalogues may be a poor guide to future hazards.

Will the climate change debate now move forward?

The release of the synthesis reports by the IPCC – in summary, short and long form – earlier this month has helped to keep the climate change debate alive. I have posted (here, here, and here) on the IPCC’s 5th assessment previously. The IPCC should be applauded for trying to present their findings in different formats targeted at different audiences. Statements such as the following cannot be clearer:

“Anthropogenic greenhouse gas (GHG) emissions have increased since the pre-industrial era, driven largely by economic and population growth, and are now higher than ever. This has led to atmospheric concentrations of carbon dioxide, methane and nitrous oxide that are unprecedented in at least the last 800,000 years. Their effects, together with those of other anthropogenic drivers, have been detected throughout the climate system and are extremely likely to have been the dominant cause of the observed warming since the mid-20th century.”

The reports also try to outline a framework to manage the risk, as per the statement below.

“Adaptation and mitigation are complementary strategies for reducing and managing the risks of climate change. Substantial emissions reductions over the next few decades can reduce climate risks in the 21st century and beyond, increase prospects for effective adaptation, reduce the costs and challenges of mitigation in the longer term, and contribute to climate-resilient pathways for sustainable development.”

The IPCC estimate the costs of adaptation and mitigation of keeping climate warming below the critical 2oC inflection level at a loss of global consumption of 1%-4% in 2030 or 3%-11% in 2100. Whilst acknowledging the uncertainty in their estimates, the IPCC also provide some estimates of the investment changes needed for each of the main GHG emitting sectors involved, as the graph reproduced below shows.

click to enlargeIPCC Changes in Annual Investment Flows 2010 - 2029

The real question is whether this IPCC report will be any more successful that previous reports at instigating real action. For example, is the agreement reached today by China and the US for real or just a nice photo opportunity for Presidents Obama and Xi?

In today’s FT Martin Wolf has a rousing piece on the subject where he summaries the laissez-faire forces justifying inertia on climate change action as using the costs argument and the (freely acknowledged) uncertainties behind the science. Wolf argues that “the ethical response is that we are the beneficiaries of the efforts of our ancestors to leave a better world than the one they inherited” but concludes that such an obligation is unlikely to overcome the inertia prevalent today.

I, maybe naively, hope for better. As Wolf points out, the costs estimated in the reports, although daunting, are less than that experienced in the developed world from the financial crisis. The costs don’t take into account any economic benefits that a low carbon economy may result in. Notwithstanding this, the scale of the task in changing the trajectory of the global economy is illustrated by one of graphs from the report, as reproduced below.

click to enlargeIPCC global CO2 emissions

Although the insurance sector has a minimal impact on the debate, it is interesting to see that the UK’s Prudential Regulatory Authority (PRA) recently issued a survey to the sector asking for responses on what the regulatory approach should be to climate change.

Many industry players, such as Lloyds’ of London, have been pro-active in stimulating debate on climate change. In May, Lloyds issued a report entitled “Catastrophic Modelling and Climate Change” with contributions from industry. In the piece from Paul Wilson of RMS in the Lloyds report, they concluded that “the influence of trends in sea surface temperatures (from climate change) are shown to be a small contributor to frequency adjustments as represented in RMS medium-term forecast” but that “the impact of changes in sea-level are shown to be more significant, with changes in Superstorm Sandy’s modelled surge losses due to sea-level rise at the Battery over the past 50-years equating to approximately a 30% increase in the ground-up surge losses from Sandy’s in New York.“ In relation to US thunderstorms, another piece in the Lloyds report from Ionna Dima and Shane Latchman of AIR, concludes that “an increase in severe thunderstorm losses cannot readily be attributed to climate change. Certainly no individual season, such as was seen in 2011, can be blamed on climate change.

The uncertainties associated with the estimates in the IPCC reports are well documented (I have posted on this before here and here). The Lighthill Risk Network also has a nice report on climate model uncertainty which concludes that “understanding how climate models work, are developed, and projection uncertainty should also improve climate change resilience for society.” The report highlights the need for expanding geological data sets beyond short durations of decades and centuries which we currently base many of our climate models on.

However, as Wolf says in his FT article, we must not confuse the uncertainty of outcomes with the certainty of no outcomes. On the day that man has put a robot on a comet, let’s hope the IPCC latest assessment results in an evolution of the debate and real action on the complex issue of climate change.

Follow-on comment: Oh dear the outcome of the Philae lander may not be a good omen!!!

When does one plus one equal more than two?

S&P released a thoughtful piece on Monday called “Hedge Fund Reinsurers: Are The Potential Rewards Worth The Added Risk?” I couldn’t find a direct link to the article but Artemis has a good summary here. They start by asking whether combining a reinsurer strategy with a hedge fund strategy can create higher risk adjusted returns than the two approaches could achieve separately. They conclude with the following:

“The potential crossover between hedge funds and reinsurers offers compelling possibilities. However, a commensurate focus on additional risks would have to supplement the singular focus on higher investment returns. Considering both is necessary in determining whether one plus one is truly greater than two. This depends on whether combining hedge funds and reinsurers can create additional diversification benefits that don’t occur in these two types of organisations independently, thus creating a more capital efficient vehicle. We believe it’s possible. However, in our view, closing the gap between reinsurer and hedge fund risk cultures and implementing prudent risk controls is necessary to realize these benefits.”

I have posted on this topic before. One of the hedge fund reinsurer strategies is to combine low volatility P&C business (primarily as a source of cheap “float”)with the alpha seeking asset business. My problem with this strategy is that every reinsurer is looking out for low volatility/stable return (re)insurance business (its the holy grail after all!), even more so in today’s highly efficient and competitive market. So what can clever chino wearing quants living on a tropical island offer that every other established reinsurer can’t? I suspect that the answer is to price the business with a higher discount rate based upon their higher expected return. S&P point out that this may create increased risks elsewhere such as liquidity risk in stress scenarios. Another strategy is to combine volatile property catastrophe risk with higher asset risk, essentially combining two tail risk strategies. This pushes the business model more towards the highly leveraged model as per that used by the monoline insurer, the ultimate “picking up pennies in front of a stream-roller” play.

To get an idea of the theory behind the various strategies, the graph below illustrates the diversification of each using the calculation in the Solvency II standard formula, with different concentrations for market, counterparty, life, health and non-life risks (selected for illustration purposes only).

click to enlargeHedge Fund Reinsurer Diversification

The graph shows that a hedge fund reinsurer with a low volatility liability strategy shows the least amount of diversification compared to a composite, non-life or a property cat reinsurer due to the dominance of market risk. Interesting, the high risk strategy of combining a hedge fund strategy on assets with property cat on the liability side shows diversification at a similar level (i.e. 78%) to that of a non-life reinsurer where non-life risk dominates.

Hedge fund reinsurers would no doubt argue that, through their alpha creating ability, the 25% correlation between market and non-life risk is too high for them. Reducing that correlation to 0% for the hedge fund reinsurers gives the diversification above, as per “Diversification 1” above. Some may even argue that the 25% correlation in the standard formula is too low for traditional players, as this post on Munich Re’s results excluding catastrophic losses illustrates, so I have shown the diversification for an illustrative composite, non-life or a property cat reinsurer with a 75% correlation between market and non-life risks, as per “Diversification 2” above.

In my opinion, one plus one is always two and under-priced risk cannot be justified by combining risk strategies. Risk is risk and combining two risks doesn’t change the fundamentals of each. One strategy that hasn’t re-emerged as yet is what I call the hedging reinsurer whereby liabilities are specifically hedged by asset strategies. Initially, the property cat reinsurers tried to use weather derivatives to hedge their risk but an illiquid market for weather derivatives and the considerable amount of basis risk resulted in difficulties with the strategy. The strategy is commonly used on the life side of the business with investment type business, particularly business with guarantees and options. Also the appetite for longevity risk by those reinsurers with significant mortality exposure that can significantly hedge the longevity risk is a major developing market trend. I do not see why the strategy could not be used more on the non-life side for economic related exposures such as mortgage indemnity or other credit type exposures.

In the immediate term, the best strategy that I see is the arbitrage one that those who have survived a few underwriting cycles are following, as per this post. On that point, I noticed that BRIT, in their results today, stated they have “taken advantage of current market conditions in reinsurance to significantly strengthen group wide catastrophe cover. These additional protections include a property aggregate catastrophe cover and some additional variable quota share protection”. When risk is cheap, arbitrating it makes the most sense to me as a strategy, not doubling up on risks.

Computer says yes

Amlin reported their Q1 figures today and had some interesting comments on their reinsurance and retrocession spend that was down £50 million on the quarter (from 23% of gross premiums to 18%). Approx £20 million was due to a business line withdrawal with the remainder due to “lower rates and improved cover available on attractive terms”.

Amlin also stated “with the assistance of more sophisticated modelling, we have taken the decision to internalise a proportion of a number of programmes. Given the diversifying nature of many of our insurance classes, this has the effect of increasing mean expected profitability whilst only modestly increasing extreme tail risk.

The use by insurers of their economic capital models for reinsurance/retrocession purchases is a trend that is only going to increase as we enter into the risk based solvency world under Solvency II. Current market conditions have resulted in reinsurers being more open to offering multi-line aggregate coverage which protect against both frequency and severity with generous exposure inclusions.

It will only be a matter of time, in my opinion, before reinsurers underwrite coverage directly based upon a insurer’s own capital model, particularly when such a model has been approved by a firm’s regulator or been given the blessing of a rating agency.

Also in the future I expect that firms will more openly disclose their operating risk profiles. There was a trend a few years ago whereby firms such as Endurance (pre- Charman) and Aspen did include net risk profiles, such as those in the graphs below, in their investor presentations and supplements (despite the bad blood in the current Endurance-Aspen hostile take-over bid, at least it’s one thing they can say they have in common!).

click to enlargeOperating Risk Distributions

Unfortunately, it was a trend that did not catch on and was quickly discontinued by those firms. If insurers and reinsurers are increasingly using their internal capital models in key decision making, investors will need to insist on understanding them in more detail. A first step would be more public disclosure of the results, the assumptions, and their strengths and weaknesses.