Tag Archives: book value multiple

Lancashire…so much to answer for.

My bearishness on the reinsurance and specialty insurance sector is based upon my view of a lack of operating income upside due to the growing pricing pressures and poor investment income. I have posted many times (most recently here) on the book value multiple expansion that has driven valuations over the past few years. With operating income under pressure, further multiple expansion represents the only upside in valuations from here and that’s not a very attractive risk/reward profile in my view. So I am happy to go to the sidelines to observe from here.

So, what does this mean for my previously disclosed weak spot for Lancashire, one the richest valued names in the sector? Lancashire posted YE2013 results last week and disappointed the market on the size of its special dividend. As previously highlighted, its Cathedral acquisition marked a change in direction for Lancashire, one which has confused observers as to its future. During the conference call, in response to anxious analysts, management assured the market that M&A is behind it and that its remains a nimble lead specialist high risk/high return underwriter dedicated to maximising shareholder returns from a fixed capital base, despite the lower than expected final special dividend announced for 2013.

The graph below illustrates the past success of Lancashire. Writing large lead lines on property, energy, marine and aviation business has resulted in some astonishingly good underwriting returns for Lancashire in the past. The slowly increasing calendar year combined ratios for the past 5 years and the lack of meaningful reserve releases for the past two year (2013 even saw some reserve deterioration on old years) show the competitive pressures that have been building on Lancashire’s business model.

click to enlargeLancashire Combined Ratio Breakdown 2006 to 2013

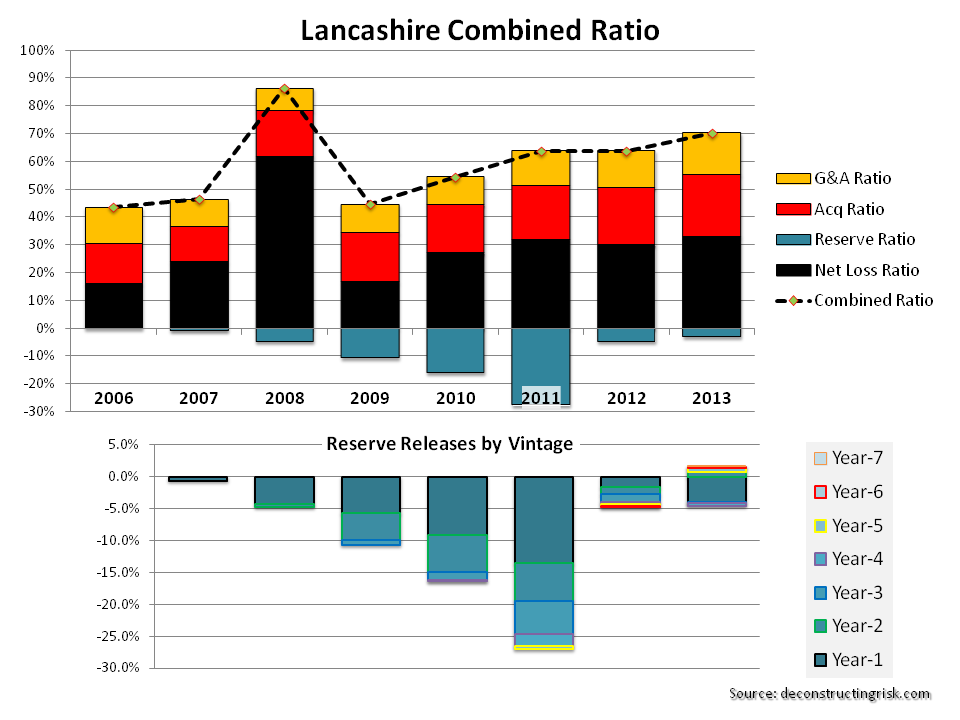
The Cathedral acquisition offers Lancashire access to another block of specialist business (which does look stickier than some of Lancashire’s business, particularly on the property side). It also offers Lancashire access to Lloyds which could have some capital arbitrage advantages if Lancashire starts to write the energy and terrorism business through the Lloyds’ platform (as indicated by CEO Richard Brindle on the call). Including the impact of drastically reducing the property retrocession book for 2014, I estimate that the Cathedral deal will add approx 25% to GWP and NEP for 2014. Based upon indications during the call, I estimate that GWP breakdown for 2014 as per the graph below.

click to enlargeLancashire GWP Split

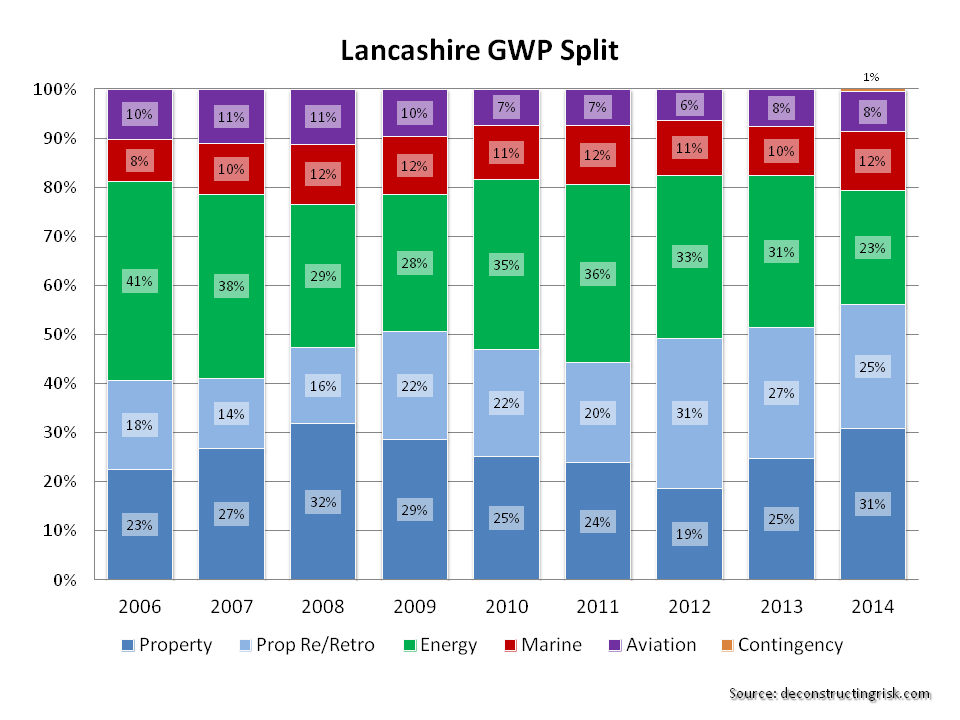
One attractive feature of Lancashire is that it has gone from a net seller of retrocession to a net buyer. Management highlighted the purchase of an additional $100 million in aggregate protection. This is reflected in the January 1 PML figures. Although both Lancashire and Cathedral write over 40% of their business in Q1, I have taken the January 1 PML figures as a percentage of the average earned premium figures from the prior and current year in the exhibit below.

click to enlargeLancashire PMLs January 2010 to January 2014

The graphs above clearly show that Lancashire is derisking its portfolio compared to the higher risk profile of the past two years (notably in relation to Japan). This is a clever way to play the current market. Notwithstanding this de-risking, the portfolio remains a high risk one with significant natural catastrophic exposure.

It is hard to factor in the Cathedral results without more historical data than the quarterly 2013 figures provided in the recent supplement (another presentation does provide historical ultimate loss ratio figures, which have steadily decreased over time for the acquired portfolio) and lsome of the CFO comments on the call referring to attritional loss ratios & 2013 reserve releases. I estimate a 68% combined ratio in 2014, absent significant catastrophe losses, which means an increase in the 2013 underwriting profit of $170 million to $220 million. With other income, such as investment income and fee income from the sidecar, 2014 could offer a return of the higher special dividend.

So, do I make an exception for Lancashire? First, even though the share price hasn’t performed well and currently trades around Stg7.30, the stock remains highly valued around 180% tangible book.  Second, pricing pressures mean that Lancashire will find it hard to make combined ratios for the combined entities significantly lower than the 70% achieved in 2013, in my view. So overall, although Lancashire is tempting (and will be more so if it falls further towards Stg7.00), my stance remains that the upside over the medium term does not compensate for the potential downside. Sometimes it is hard to remain disciplined……

Factors impacting AIG’s valuation

AIG stock has been the subject of much investor attention in recent times and has doubled over the past 24 months. The new AIG has become a hedge fund favourite, the 3rd most popular stock according to Goldman Sachs. I did briefly look over AIG at the end of 2010 when it traded around $35 but concluded there was too much uncertainty around its restructuring and I particularly didn’t like the P&C reserve deteriorations in 2009 and 2010. The stock fell below $25 in 2011 before reversing and beginning its recent accent above $45 as further clarity on its business performance emerged. I figured now is a good time to give the new AIG another look.

Unless you have been living on Mars, everybody is aware that AIG has had a very colourful history and, although it’s past is not the focus of this post, the graph below of the 10 year history of the stock is a reminder of the grim fate suffered by its equity holders with the current price still only about 5% of the pre-crash average. For what it is worth, the 2005 Fortune article “All I want in life is an unfair advantage” and the 2009 Vanity Fair article “The Man Who Crashed the World” by Michael Lewis are two of my favourites on the subject and worth a read.

click to enlargeAIG 10 year stock price

To understand the new AIG we need to review the current balance sheet and the breakdown of the sources of net income since 2010. The balance sheet (excluding segregated assets & liabilities) as at Q2 2013 is represented in the exhibit below.

click to enlargeAIG Balance Sheet & Assets

AIG’s liquid assets look reasonably diverse and creditworthy although these assets should really be looked at in their respective business units. The P&C assets are the more conservative and look in line with their peers. The life and retirement assets are riskier and reflect the underling product mix and risk profile of that business.

Another item to note is the $31.2 billion of aircraft leasing assets from ILFC against the $26.5 billion of liabilities representing $4.7 billion of net assets. AIG’s deal to sell 80% of ILFC to a Chinese consortium for book value looks like it may fall apart. If it does, the possibility of going down the IPO route is now a realistic option, absent a change in current market conditions.

The next item to note is the other assets representing 13% of total assets. These are primarily made up of $20 billion of deferred taxes, $9 billion of DAC, $14 billion of premium receivables, and $15 billion of various assets. This last item includes $2.8 billion of fair value derivative assets which correspond to $3.1 billion of fair value derivative liabilities. The notional value of these assets and liabilities is approximately $90 billion and $110 billion respectively from primarily interest rate contracts but also FX, equity, commodity and credit derivatives that are not designated for hedging purposes. The majority (about 2/3rd) of these are from the Global Capital Markets division which includes the run-off of the infamous AIG Financial Products (AIGFP) unit.

AIG’s non-life reserves, at $108 billion, have been a source of volatility in the past with significant strengthening required in 2002, 2004, 2005, 2009 and 2010. The life and retirement reserves are split $121 billion of policyholder contracts (including guaranteed variable annuity products like GMWB), $5 billion of other policyholder funds, and $40 billion of mortality and morbidity reserves.

A breakdown of AIG’s net income since 2010 shows the sources of profit and losses as per the graph below.

click to enlargeAIG Net Income Breakdown 2010 to Q22013

The graph shows that the impact of discontinued operations has been playing less of a part in the net income line. It also points to the need to understand the importance of the other business category in 2011 and 2012 as well as the relative underperformance in the P&C division in contributing to net income for 2010 to 2012.

In 2011, contributors to other pre-tax income included a $1.7 billion impairment charge on ILFC’s fleet and a net $2.9 billion charge due to the termination of the New York Fed credit facility. 2012 net income included a $0.8 billion gain on the sale of AIA shares and an increase of $2.9 billion in the fair value of AIG’s interest in Maiden Lane III (the vehicle created during the AIG bailout for AIGFP’s CDO credit default swap portfolio). These 2012 gains were partially offset by an increase of $0.8 billion in litigation reserves.

AIG bulls point to the 2013 YTD performance. Improved operating margins in the core P&C and life/retirement units have combined with income from the other activities (mortgage business, Global Capital Markets & Direct Investment portfolios) covering corporate and interest expenses and any other one off charges (such as those in the paragraph above). This performance has led analysts to predict 2013 EPS around $4.20 and 2014 EPS of $4.30 to $4.50.

AIG has traded at a significant discount to its peers on a book value basis as a result of its troubled past and currently trades at 0.73. The graphs below uses recently published book values and book value excluding Accumulated Other Comprehensive Income (AOCI) which have been the subject to adjustment and reinstatement and may not therefore reflect the book values published at the time.

click to enlargeAIG stock price to book values 2009 to August 2013

AIG Book Value Multiples 2009 to August 2013

In summary, the factors impacting the current AIG valuation are the significant book value discount as a result of AIG’s history, the uncertainty around the ILFC sale, the future prospects of the core P&C and life/retirement units, and the historical volatility in the other operating business lines (and the potential for future volatility!). Each of these items need to be understood further before any conclusions can be reached on whether AIG is currently undervalued or overvalued. In a follow-on post on AIG I will try to dig deeper into each of these factors and also offer my thoughts on future performance and valuation of the new AIG.