Tag Archives: investing ideas

Uniting Gamesters

BWIN’s on-going search to “create shareholder value” seems to be moving on with the announcement that it “has entered into preliminary discussions with a number of interested parties regarding a variety of potential business”. A previous post on a number of the main players in the European gambling sector highlighted that William Hill and Paddy Power were speculated to be potential bidders for all or parts of BWIN, a European online gaming firm with a concentration of approx 25% of revenues from Germany. Now press reports speculate the potential interested parties include the Canadian firm Amaya, who purchased PokerStars/Full Tilt earlier this year, and Playtech, a software gaming firm that are “seeking transformational M&A opportunities to take the business to the next level”.

Commentators raised an eyebrow about the speculated 45% premium on offer (from before discussions were reported) given BWIN’s operating metrics and the uncertainty over the key German market. Speculation involving Playtech focussed on their recent debt raising which brings their cash-pile to around €700 million. Playtech’s shareholders may not be too pleased if their new strategy moves too far away from the very profitable software business, particularly considering the alternative of continuing with their generous special dividends. Taking on businesses such as BWIN, or even another speculated target like Ladbrokes, is a far cry from what made Playtech such a star.

In fact, the best performer in the sector (in fact the only name that’s in positive territory!) is the reinvigorated Betfair under Breon Corcoran (see previous post on Betfair) as can be seen below (they also have cash to spend on potential M&A).

click to enlargeShare price YTD selected betting stocks

This is a fascinated sector that is in the midst of considerable change. Although I have no financial interest in the sector, I am an intrigued bystander. Bring on the next development.

The fascinating case of Betfair

With the ending of the World Cup, my attention turned again to my attempts at understanding the issues facing the betting and gambling sector. For the sake of full disclosure, I am a novice on the sector (I am not a gambler if investing and the odd poker game are not included as such) and have no positions in any betting or gaming stock. My ramblings here, and in previous posts, simply illustrate my attempts to satisfy my curiosity about a sector that is at a fascinating point of change.

In a previous post, I highlighted the changes that the internet has had on the betting and gaming sectors. At that time, I thought the impact of the disintermediating betting exchanges on traditional business models could provide interesting insights into other disintermediating businesses in the financial sector. However, as I have found out more about the sector, such as the results of the traditional betting firms in the UK as per this post, there are a multitude of issues facing the sector such that a review of the impact of the betting exchanges in isolation is not that informative and (frankly) outdated given current developments. Recent developments include regulatory changes such as those in the US which has prompted the purchase of the largest online poker firm Pokerstars by approximately $5 billion by Amaya Gaming and new online taxes such as the forthcoming UK point of consumption (POC) tax of 15% due in December.

As the graph of Betfair’s share price since its floatation in late 2010 shows, the betting exchange model clearly has not had much of a disruptive impact on the traditional business models in recent years.

click to enlargeBetfair historical share price

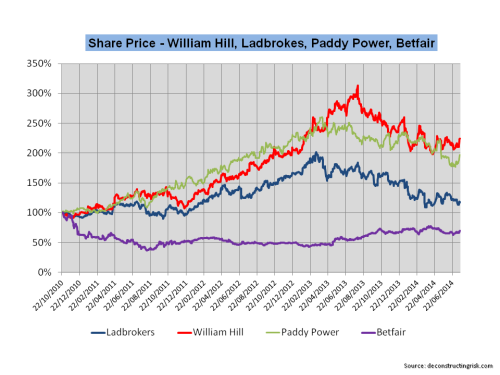
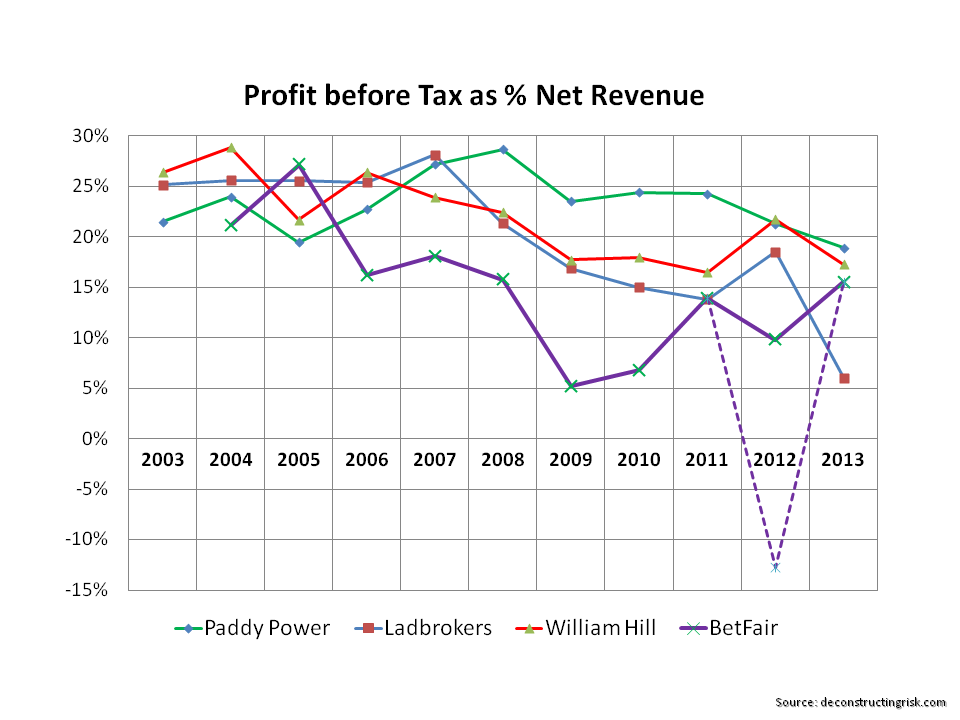
Rather than go over Betfair’s eventful past in detail here, I will focus on current issues. Niall O’Connor in his blog, bettingmarket.com, has a number of informative articles on the history of Betfair, including this one. Below, I show a graph of Betfair’s profit before tax against the other UK betting firms which illustrates its difficulties in the recent past. The 2012 results (which are Betfair’s YE 2013 results as their year ends in April) exclude some write-offs and adjustments as a result of Betfair’s turnaround plan (which are included in the dotted line). The plan involved refocusing on sustainable geographical betting markets with accommodative regulations and developing a fixed odds betting business alongside the exchange to optimise the liquidity advantages of each model.

The new plan, in effect, admitted that the stand alone betting exchange model was flawed and that some markets “may not have sufficient liquidity to offer an optimal betting experience, notably in ante post and ancillary markets“. The firm estimates its share of the sophisticated bettor market of £150 million at 60-70% but its share of the recreational and occasional bettor market of £500 million at less than 10%. This market is where they see growth and Breon Corcoran, previously Paddy Power’s COO, was brought in as Betfair’s new CEO in August 2012 to execute on the new direction. The most recent results show that the new strategy is delivering better results.

click to enlargeBetfair 10 year Profit Before Tax margins

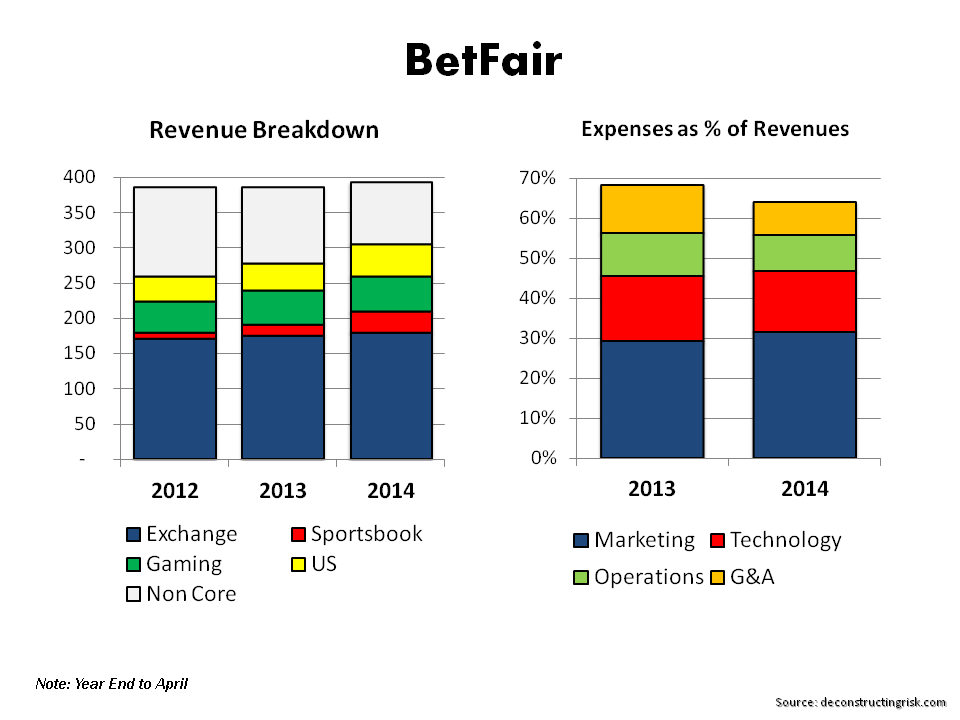
The focus on sustainable betting markets and cost cutting whilst increasing marketing spending (Betfair were high profile in recent World Cup advertising) can be seen in the graph below. Product development in features such as cash out and price rush (automatically gives the best odds from fixed odds and exchange) are being heavily pushed, particularly in the growingly important mobile market.

click to enlargeBetfair Revenue & Expense Breakdown

As mentioned in the previous post, there is a vast body of academic research on the gambling market and with the wealth of data that Betfair offers, the betting exchange market has been no exception in the studies. The Institute for Strategy and Business Economics in the University of Zurich in particular has some interesting papers. This one, for example, contends that there is a growing body of evidence that exchange markets “exhibit high prediction accuracy as they regularly outperform non-market forecasting methods”. The well-documented long-shot bias where the tendency to overvalue underdogs by fixed odd markets “is less pronounced in person-to-person betting” and this can be used by traders on the betting exchange to arbitrage price differences.

There is a particularly interesting paper by Egon Franck, Raphael Flepp and Stephan Nüesch in the University of Zurich from December 2013 on the importance of liquidity in determining price competitiveness which the authors offer as one of the reasons behind BetFair’s move into fixed odds online betting. Other arbitrage opportunities indentified by research include bookmakers actively shading prices in the presence of a partly irrational betting audience in order to increase their profit (e.g. sentiment bias in football games by the home fans) or the movement in odds prior and during games with the growth of in-play betting.

The development of sports investment funds was previously highlighted in a Bloomberg article and despite an early hic-cup with the collapse of a fund called Centaur there are many now developing predictive algorithms which try to take advantage of arbitrage opportunities. BetFair is consistently looking at how it can optimise its pricing (on the exchange it earns its commissions on winnings by a sliding scale on volume) in different geographical areas and sports to maximise its commissions, despite an outcry from a pricing charge change a few years ago.

Although BetFair face considerable challenges (e.g. I estimate that 95% of BetFair’s sustainable revenues are concentrated in the UK and the firm disclosed that the POC tax, if implemented as currently envisaged, would of cost them £36 million for their 2014 year, one with £61 million of operating profit!) in the short to medium term, one of their strengths is the balance sheet with a net asset ratio of 55% and a cash pile of over £200 million and a strong cash generating business. In their latest results Corcoran commented that “the flexibility we retain through our strong balance sheet provides a competitive advantage during uncertain times for the gaming sector. We will continue to review our balance sheet on a regular basis.” Although Betfair are a fascinating case to keep an eye on, the uncertainties on the POC tax issues outweigh any positive investment case for now.

In my attempts at understanding the sector more, these comments led me to look at some other models (and possible acquisition targets) in the other publically traded online firms, mainly on the gaming side. Names that I have looked at include 888, BWIN (currently looking at strategic options!) and 32Red. I am also intrigued by the software gaming firm Playtech which provides the underlying software to many firms in the sector. I will follow-up with a post on further musings.

ILS Fund versus PropertyCat Reinsurer ROEs

Regular readers will know that I have queried how insurance-linked securities (ILS) funds, currently so popular with pensions funds, can produce a return on equity that is superior to that of a diversified property catastrophe reinsurer given that the reinsurer only has to hold a faction of its aggregate limit issued as risk based capital whereas all of the limits in ILS are collaterised. The recent FT article which contained some interesting commentary from John Seo of Fermat Capital Management got me thinking about this subject again. John Seo referred to the cost advantage of ILS funds and asserted that reinsurers staffed with overpaid executives “can grow again, but only after you lay off two out of three people”. He damned the traditional sector with “these guys have been so uncreative, they have been living off earthquake and hurricane risks that are not that hard to underwrite.

Now, far be it from me to defend the offshore chino loving reinsurance executives with a propensity for large salaries and low taxation. However, I still can’t see that the “excessive” overheads John Seo refers to could offset the capital advantage that a traditional property catastrophe reinsurer would have over ILS collateral requirements.

I understood the concept of ILS structures that provided blocks of capacity at higher layers, backed by high quality assets, which could (and did until recently) command a higher price than the traditional market. Purchasers of collaterised coverage could justify paying a premium over traditional coverage by way of large limits on offer and a lower counterparty credit risk (whilst lowering concentration risk to the market leading reinsurers). This made perfect sense to me and provided a complementary, yet different, product to that offered by traditional reinsurers. However, we are now in a situation whereby such collaterised reinsurance providers may be moving to compete directly with traditional coverage on price and attachment.

To satisfy my unease around the inconsistency in equity returns, I decided to do some simple testing. I set up a model of a reasonably diversified portfolio of 8 peak catastrophic risks (4 US and 4 international wind and quake peak perils). The portfolio broadly reflects the market and is split 60:40 US:International by exposure and 70:30 by premium. Using aggregate exceedance probability (EP) curves for each of the main 8 perils based off extrapolated industry losses as a percentage of limits offered across standard return periods, the model is set up to test differing risk premiums (i.e. ROL) for each of the 8 perils in the portfolio and their returns.  For the sake of simplicity, zero correlations were assumed between the 8 perils.

The first main assumption in the model is the level of risk based capital needed by the property catastrophe reinsurer to compete against the ILS fund. Reviewing some of the Bermudian property catastrophe players, equity (common & preferred) varies between 280% and 340% of risk premiums (net of retrocessions). Where debt is also included, ratios of up to 400% of net written premiums can be seen. However, the objective is to test different premium levels and therefore setting capital levels as a function of premiums distorts the results. As reinsurer’s capital levels are now commonly assessed on the basis of stressed economic scenarios (e.g. PMLs as % of capital), I did some modelling and concluded that a reasonable capital assumption for the reinsurer to be accepted is the level required at a 99.99th percentile or a 1 in 10,000 return period (the graph below shows the distribution assumed). As the graph below illustrates, this equates to a net combined ratio (net includes all expenses) of the reinsurer of approximately 450% for the average risk premium assumed in the base scenario (the combined ratio at the 99.99th level will change as the average portfolio risk premium changes).

click to enlargePropCAT Reinsurer Combined Ratio Distribution

So with the limit profile of the portfolio is set to broadly match the market, risk premiums per peril were also set according to market rates such that the average risk premium from the portfolio was 700 bps in a base scenario (again broadly where I understand the property catastrophe market is currently at).

Reviewing some of the actual figures from property catastrophe reinsurer’s published accounts, the next important assumption is that the reinsurer’s costs are made up of 10% acquisition costs and 20% overhead (the overhead assumption is a bit above the actual rates seen by I am going high to reinforce Mr Seo’s point about greedy reinsurance executives!) thereby reducing risk premiums by 30%. For the ILS fund, the model assumes a combined acquisition and overhead cost of just 10% (this may also be too light as many ILS funds are now sourcing some of their business through brokers and many reinsurance fund managers share the greedy habits of the traditional market!).

The results below show the average simulated returns for a reinsurer and an ILS fund writing the same portfolio with the expense levels as detailed above (i.e 30% versus 10%), and with different capital levels (reinsurer at 99.99th percentile and the ILS fund with capital equal to the limits issued). It’s important to stress that the figures below do not included investment income so historical operating ROEs from property catastrophe reinsurers are not directly comparable.

click to enlargePropCAT Reinsurer & ILS Fund ROE Comparison

So, the conclusion of the analysis re-enforces my initial argument that the costs savings cannot compensate for the leveraged nature of a reinsurer’s business model compared to the ILS fully funded model. However, this is a simplistic comparison. Why would a purchaser not go with a fully funded ILS provider if the product on offer was exactly the same as that of a reinsurer? As outlined above, both risk providers serve different needs and, as yet, are not full on competitors (although this may be the direction of the changes underway in the market currently).

Also, many ILS funds likely do use some form of leverage in their business model whether by way of debt or retrocession facilities. And competition from the ILS market is making the traditional market look at its overhead and how it can become more cost efficient. So it is likely that both business models will adapt and converge (indeed, many reinsurers are now also ILS managers).

Notwithstanding these issues, I can’t help conclude that (for some reason) our pension funds are the losers here by preferring the lower returns of an ILS fund sold to them by investment bankers than the higher returns on offer from simply owning the equity of a reinsurer (admittedly without the same operational risk profile). Innovative or just cheap risk premia? Go figure.