
To recap on the bear case for the US equity market, factors highlighted are high valuation as measured by the cyclically adjusted PE ratio (CAPE) and the high level of corporate earnings that look unsustainable in a historical context. I have tried to capture these arguments in the graph below.
click to enlarge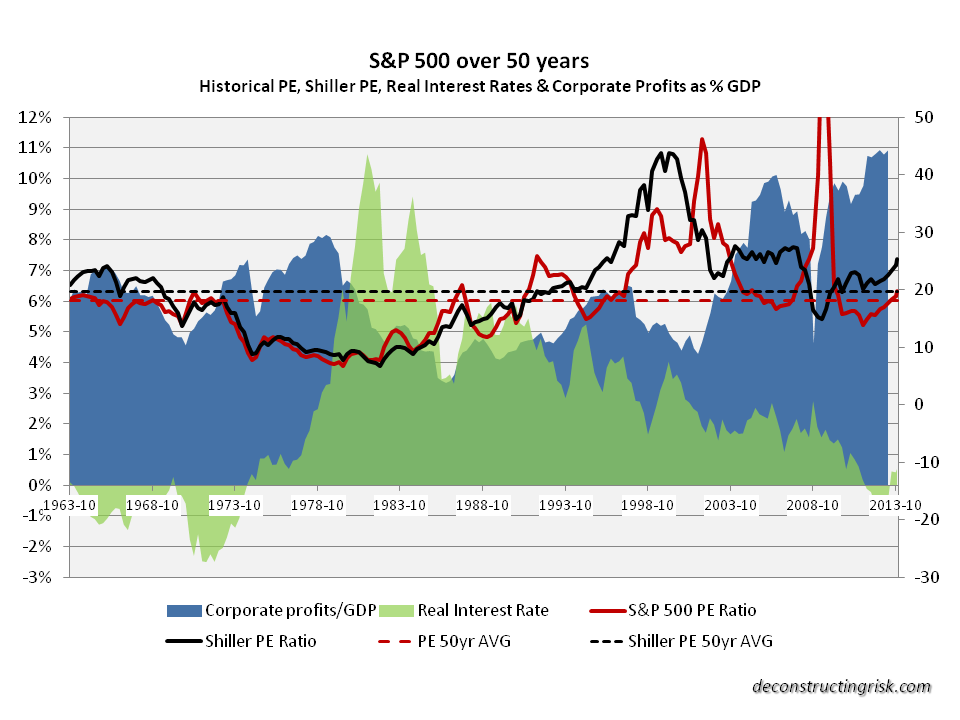 Currently, the S&P500 PE and the Shiller PE/CAPE are approx 10% and 30% above the average over the past 50 years respectively.
On earnings, Andrew Lapthorne of SocGen, in an August report entitled “To ignore CAPE is to deny mean reversion” concluded that “mean-reversion in earnings, though sometimes delayed, is as undeniable as the economic cycle itself. That peak profits typically accompany peak valuations only reinforces the point. When earnings revert back to mean (and below), the valuation will also collapse.” The graphic below from that report highlights the point.
click to enlarge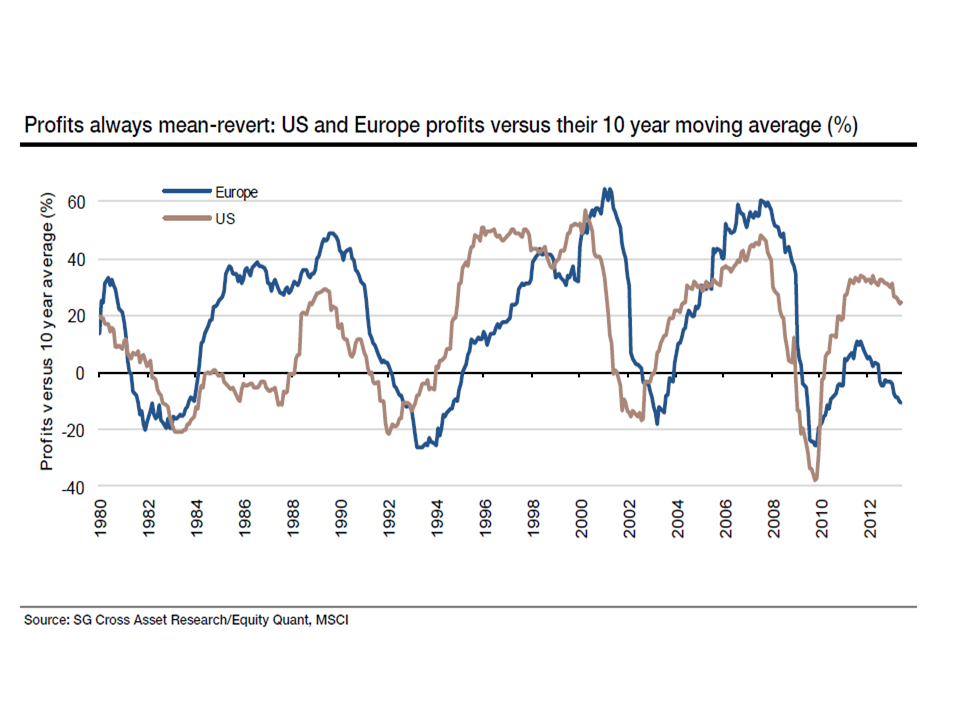 The ever bullish Jeremy Siegel, in a recent conference presentation, again outlined his arguments raised in the August FT article (see Shiller versus Siegel on CAPE post). The fifth edition of his popular book “Stocks for the long run” is out in December. Essentially he argues that CAPE is too pessimistic as accounting changes since 1990 distort historical earnings and the profile of S&P500 earnings has changed with bigger contributions from foreign earnings and less leveraged balance sheets that explain the higher corporate margins.
Siegel contends that after-tax profits published in the National Income and Product Accounts (NIPA) are not distorted by the large write downs from the likes of AOL and AIG. The changing profile of NIPA versus S&P reported earnings through historical downturns illustrate that historical S&P reported earnings are unreliable, as illustrated in the graph below.
click to enlarge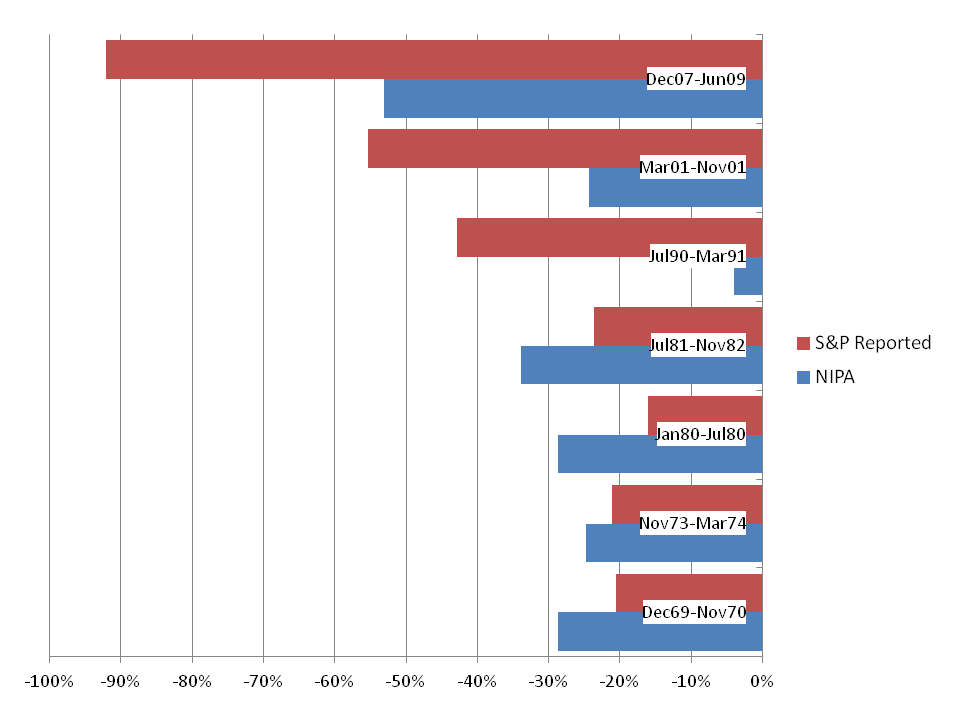
However, even using NIPA data, a graphic from JP Morgan in late October shows that currently the S&P500 is approx 20% above its 50 year average.
click to enlarge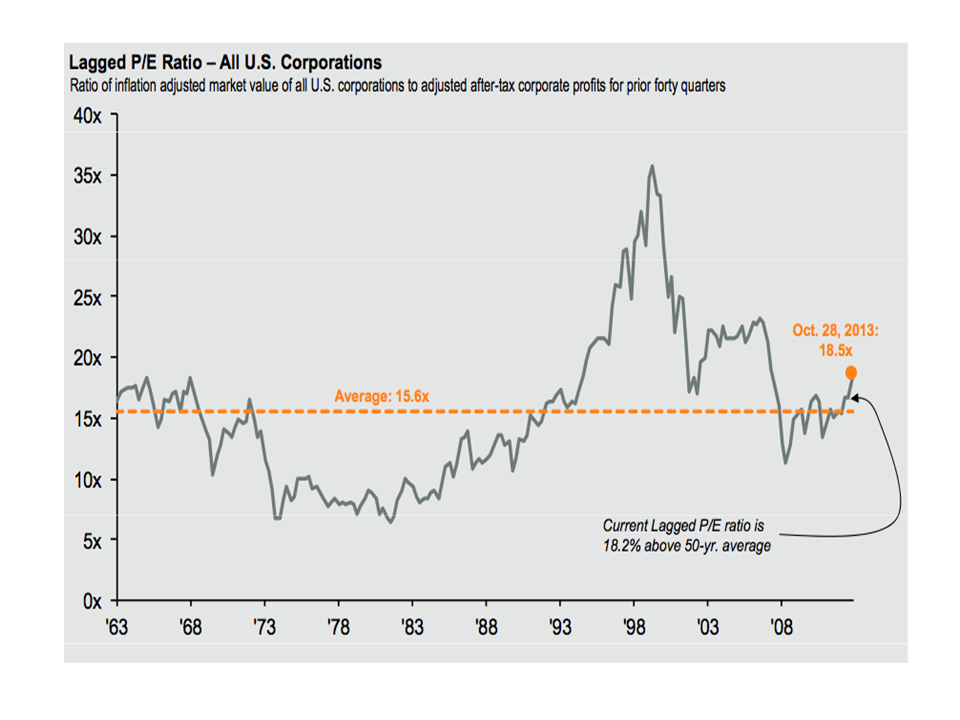 Siegel even proposed that current comparison should be against the long term average PE (1954 to 2013) of 19 including only years where interest rates were below 8% (which incidentally is only slightly higher than the 8.2 5o year average used in the first graph of this post).
The ever insightful Cliff Asness, founder of AQR Capital Management, counteracts such analysis with the recent comment below.
Does it seem to anyone else but me that the critics have a reason to exclude everything that might make one say stocks are expensive, and instead pick time periods for comparisons and methods of measurement that will always (adapting on the fly) say stocks are fair or cheap?
However, nothing is as black and white in the real world. The rise in corporate net margins has been real as another recent graphic, this time from Goldman Sachs, shows.
click to enlarge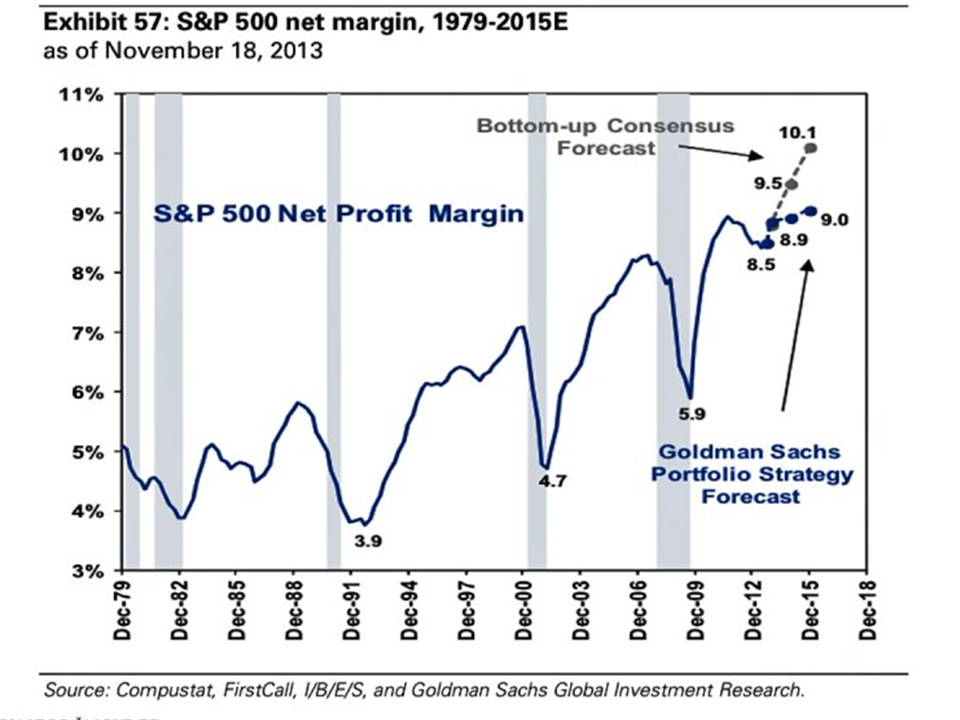
Earnings from foreign subsidiaries have increased and S&P500 earnings as a percentage of global GDP show a more stable picture. Also leverage is low compared to historical levels (104% debt to equity for S&P500 compared to a 20 year average of 170%) and cash as a percentage of current assets is also high relative to history (approx 28%). Although there is signs that corporate leverage rates are on the rise again, future interest rate rises should not have as big an impact on corporate margins as they have historically.
JP Morgan, in another October bulletin, showed the breakdown of EPS growth in the S&P500 since 2010, as reproduced below, which clearly indicates a revenue and margin slowdown.
click to enlarge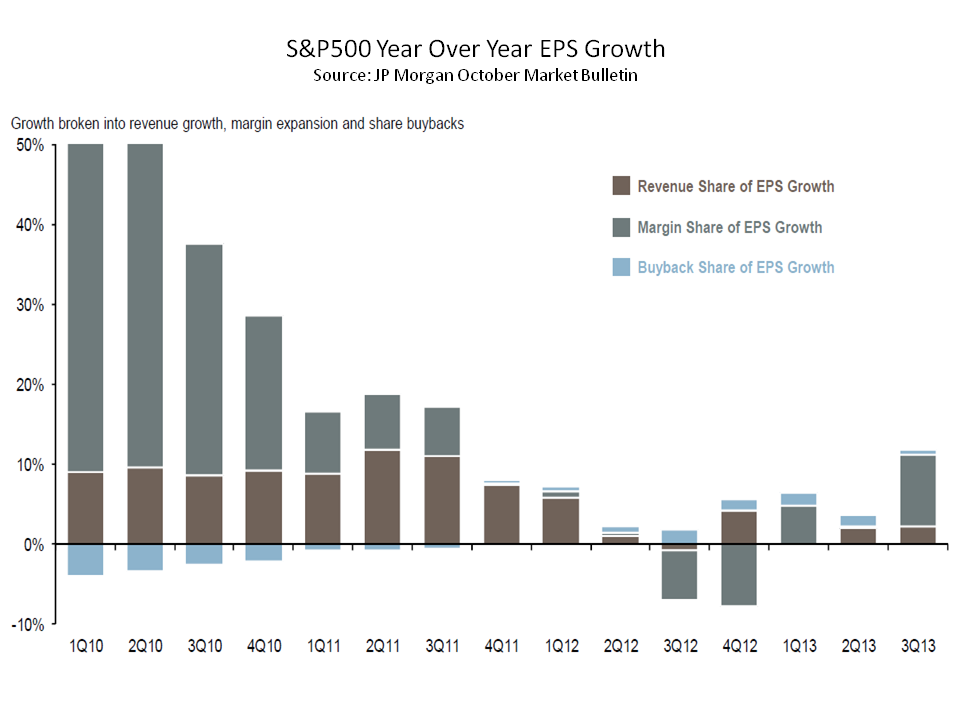 David Bianco of Deutsche Bank has recently come up with a fascinating graphic that I have been looking at agog over the past few days (reproduced below). It shows the breakdown of S&P500 returns between earnings growth, dividends and PE multiple expansion.
click to enlarge Bianco, who has a 2014 end target of 1850 and a 2015 end target of 2000 for the S&P500, concluded that 75% of the S&P500 rise in 2013 is from PE expansion and that “this is the largest [valuation multiple] contribution to market return since 1998. Before assuming further [multiple] expansion we think it is important that investors be confident in healthy EPS growth next year. Hence, we encourage frequent re-examination of the capex and loan outlook upon new data points.”
David Kostin from Goldman Sachs, who have a 2,100 S&P end 2015 target, stated that “multiple expansion was the key U.S. equity market story of 2013. In contrast the 2014 equity return will depend on earnings and money flow rather than further valuation re-rating.”
Even well known pessimists like David Rosenberg and Nouriel Roubini are positive albeit cautious. Dr Doom has a 2014 target for S&P500 of 1900 (range 1650 to 1950) although he does give the US equity market an overall neutral rating. Rosenberg, who describes the current rally as “the mother of all liquidity rallies“, cites the US economy’s robustness over the past year as a sign that 2014 should see a further strengthening of the US economy.
So clearly future growth in the S&P500 will depend upon earnings and that will depend upon the economy and interest rates. Although I am still trying to get my head around a fascinating article from 2005 that shows negative correlation between equity returns and GDP growth, that brings me back to the macro-economic situation.
I know this post was to have represented the positive side of the current arguments but, as my current bear instincts can’t be easily dispelled, I have to conclude the post with the comments from Larry Summers at a IMF conference earlier this month that the US may be stuck in a “secular stagnation” and that the lesson from the crisis is “it’s not over until it is over, and that is surely not right now”.

Good post !
What I also read between the lines is the human tendency towards linear extrapolation (since the S&P has gone up for the last couple of years it will continue to do so) and why economics is called the dismal science. Since we cannot conduct experiments and observe the variation in outcomes under parameter changes we have to see what the data can tell us (my preferred approach). Punters like Siegel usually argue that the old truths don’t hold anymore (“This time it’s different !”) and that we have to adjust the data for some reason. On the other hand we can backtest the for example the CAPE based on the data provided by Shiller on his website. Even if you throw out the first 20 or 30 years and start after WW I you can draw the conclusion that high prices (measured in terms of relatively high CAPE) yield crappy results and vice versa. Imo stuff that held water for 100 years or so should not be that easily dismissed. A similar argument I hear every now and then is that we should exclude the 2008 / 2009 experience from the calculation since it is “not typical”. Same for 2001 / 2002. It seems like markets are simply not supposed to crash…
Anyway, this doesn’t mean that armageddon is near. It just means that buying an index tracker today and holding it for 10 years (something people seem to forget… assuming that you can somehow “cleverly” buy and sell in between for a few extra bucks) will give you crappy returns. Nothing more, nothing less.
Btw, I got another nice paper from SocGen. It is stamped so I don’t want to upload it somewhere. If you are interested feel free to drop me a mail.
Cheers,
Eddie
Thanks Eddie, I’ll email you on that report.
M
A comment from Juhn Hussman on usage of NIPA data (from his Sept 9, 2013 weekly market comment):
“One of the more intellectually distressing arguments on this front suggested replacing S&P 500 earnings with NIPA (National Income and Product Accounts) profit figures in the calculation of the Shiller P/E. This is an apples-to-oranges calculation, as NIPA figures measure economy-wide profits in dollars and are neither restricted to the S&P 500 nor include the per-share adjustments that index earnings do. Still, one can see why the substitution is superficially attractive: the ratio of NIPA profits to Shiller earnings has surged to the highest level in history in recent years, mirroring similarly elevated profit margins. Unfortunately, even much less breathtaking elevations in NIPA profits / Shiller earnings in the past have been regularly followed by weak subsequent growth in NIPA profits, as profit margins retreat. Moreover, the substitution of NIPA profits into the Shiller calculation substantially weakens, rather than strengthens, its relationship with subsequent S&P 500 total returns. ”
Eddie