Monthly Archives: February 2017

Hedge Blues

For many years Warren Buffet has been highlighting the benefits of investing in a low cost index fund over paying return sapping fees to professional “helpers”. In Buffet’s 2016 letter, released over the weekend, he estimates approx $100 billion in fees have been wasted by investors in the past decade in “the search by the elite for superior investment advice”.

The selected returns by hedge funds, specifically fund of funds, since 2008 in the letter make Buffet’s point strongly (those funds were selected by Ted Seides in the wager with Buffet). Although I have no love for the overpaid superheros of the hedge fund world, Buffet’s wager has the tail wind of a particularly bad run of returns from the hedgies of late. The graph below shows the average 10 year returns from the S&P500 (including dividends less 15 basis points for fees) against hedge fund returns, net of fees, from the BarclayHedge website (I only selected those categories with more than 99 funds included).

click to enlarge10-year-average-hedge-fund-returns-2006-to-2016

Clearly, the 10 year averages for the past 5 years haven’t been kind to the masters of the universe. That may be reflective of a permanent change in markets, due to anything from more regulation to the era of low risk premia to less leverage to size. Buffet puts it down to success attracting too much capital and managers subsequent addiction to fees. I do like the explanation given by Bill Ruane from Buffet’s letter in the following quote – “In investment management, the progression is from the innovators to the imitators to the swarming incompetents.”

Oh AIG, where art thou?

In my last post on AIG, I expressed my doubts about the P&C targets outlined in their plan. After first announcing a $20 billion retroactive reinsurance deal with Berkshire covering long tail commercial P&C reserves for accident years prior to 2015 in January, AIG just announced another large commercial lines reserve charge of $5.6 billion principally from their US business. The graph below shows the impact upon their 2016 pre-tax operating income.

click to enlargeaig-pretax-operating-income-2012-to-2016

The latest reserve hit amounts to 12% of net commercial reserves at end Q3 2016 and compares to 7%, 8% and 6% for previous 2015, 2010, and 2009 commercial reserve charges. Whereas previously reserve strengthening related primarily to excess casualty and workers compensation (WC) business (plus an asbestos charge in 2010), this charge also covers primary casualty and WC business. The accident year vintage of the releases is also worryingly immature, as the graph below shows. After the 2016 charge, AIG have approx $7 billion of cover left on the Berkshire coverage.

click to enlargeaig-reserve-strengthening-accident-year-distribution

Although AIG have yet again made adjustments to business classifications, the graph below shows near enough the development of the accident year loss ratios on the commercial book over recent times.

click to enlargeaig-commercial-pc-accident-year-loss-ratios-2011-to-2016

It is understandable that AIG missed their aggressive target against the pricing background of the past few years as illustrated by the latest Marsh report, as the exhibits below on global commercial rates and the US and European subsets show.

click to enlargeglobal-insurance-market-index

click to enlargeus-europe-insurance-market-index

All of these factors would make me very skeptical on the targeted 62% exit run rate for the 2017 accident year loss ratio on the commercial book. And no big reinsurance deal with Berkshire (or with Swiss Re for that matter) or $5 billion of share buybacks (AIG shares outstanding is down nearly a third since the beginning of 2014 due to buybacks whilst the share price is up roughly 25% over that period), can impact the reality which AIG has now to achieve. No small ask.

Some may argue that AIG have kitchen-sinked the reserves to make the target of accident year loss ratios in the low 60’s more achievable. I hope for the firm’s sake that turns out to be true (against the odds). The alternative may be more disposals of profitable (life) businesses, possibly eventually leading to a sale of the rump and maybe the disappearance of AIG altogether.

Tech Treks

One lesson from the internet bubble is that big is beautiful in tech. But longevity is another lesson, think Yahoo! So one must be fickle in ones tech affections and one must never ever pay too much. After much patience, I was lucky enough to eventually get into Apple in early 2013 when sentiment was particularly sore. I didn’t manage to heed my own advice on getting into Google at a reasonable price in December 2014 when it was trading around 60% of its current value, as per this post on internet relative valuations (more on that post later). Since 2013, I have watched sentiment gyrate on AAPL as the standard graph I use below illustrates (most recent AAPL posts are here and here). I used the current $135 price high as the most recent data point for the Q12017 valuation.

click to enlargeaapl-forward-12-month-pe-ratios-q1-2017

Investors and analysts seem giddy these days about the impact of Trump tax changes and the iPhone 10 year anniversary on AAPL and have been pointing to Berkshire’s position increase in AAPL as confirmation bias of more upside. I, on the other hand, have been taking some of AAPL off the table recently on valuation concerns and will likely again be a buyer when the inevitable worries return along the “one trick iPhone pony” lines. God bless gyrating sentiment! Even Lex in the FT was saying today that the current TTM PE ex net cash of 13 is reasonable (eh, a TTM PE ex net cash of 7 a year ago was more reasonable)! AAPL still has be a core holding in anybody’s portfolio but prudent risk management requires trimming at this price in my opinion.

In my search for new ideas whilst I await some divine sense to emerge from the Trump & Brexit fog, I thought it would be interesting to revisit the post referred above on internet valuations. First off, I took the graph showing forward PEs to projected EPS growth using analyst estimates from December 2014 and inserted the actual change in share price from then to now. Two notable exceptions, at the extremities, from the graph below are Amazon and Twitter with share price changes of 173% and -56% respectively.

click to enlargeinternet-multiples-dec14-as-at-feb17

Although every company is different and has its own dynamics, my simplistic take from the graph below is that high PE stocks (e.g. > 40) with high EPS projections (e.g. > 35%) can easily run aground if the initial high growth phase hits harsh reality. The sweet spot is decent PEs with EPS growth in the 15% to 35% range (again assuming one can get comfortable that the EPS growth projections are real) indicative of the larger established firms still on the growth track (but who have successfully navigated the initial growth phase) .

A similar screen based upon today’s values and analyst estimates out to 2018 is presented below. This screen is not directly comparable with the December 2014 one as it goes out two years rather than one.

click to enlargeinternet-multiples-feb2017

Based upon this graph, Google and Netease again look worthy of investigation with similar profiles to two years ago. Netease has the attraction of a strong growth track record with the obvious Chinese political risk to get over. Expedia looks intriguing given the strong growth projected off a depressed 2016 EPS figure. Ebay and Priceline may also be worth a look purely on valuation although I have a general aversion to retail type stocks so I doubt I’ll bother look too deeply. All of the data used for these graphs is based upon analyst estimates which also need to be validated.

Valuations currently are juicy, generally too juicy for me, so this exercise is simply one to determine who to investigate further for inclusion on a watch-list. Time permitting!

Bad education

I have been neglecting this blog as the soap opera that is American politics has been playing out. Trump’s decision to go for it full throttle straight from the off looks like resulting in political war in the US which will no doubt result in a messy few weeks, if not months, ahead. The jury is still out on whether this new form of extreme politics can survive indefinitely, or whether one of Trump’s skeletons will come crashing out of the closet, or whether Trump gets catch out dealing with an unexpected event. For the Democrats, there is the depressing thought that if Trump messes up big time, the option of impeachment requiring their consent to a two third majority in congress, would only result in President Pence!

My instinct is telling me to reduce equity exposure currently, on valuation concerns rather than political ones, and my hard fought for risk management discipline means I am acting on that instinct. I also distrust the neatness of the market consensus that markets will rise on stimulus hopes to mid year before falling back to sustainable valuations by year end. Reality is never neat, especially I suspect in Mr Trumpland. Notwithstanding this environment, one of my new year’s resolutions was to try and get some new equity ideas to track and maybe pick up if valuations get more attractive.

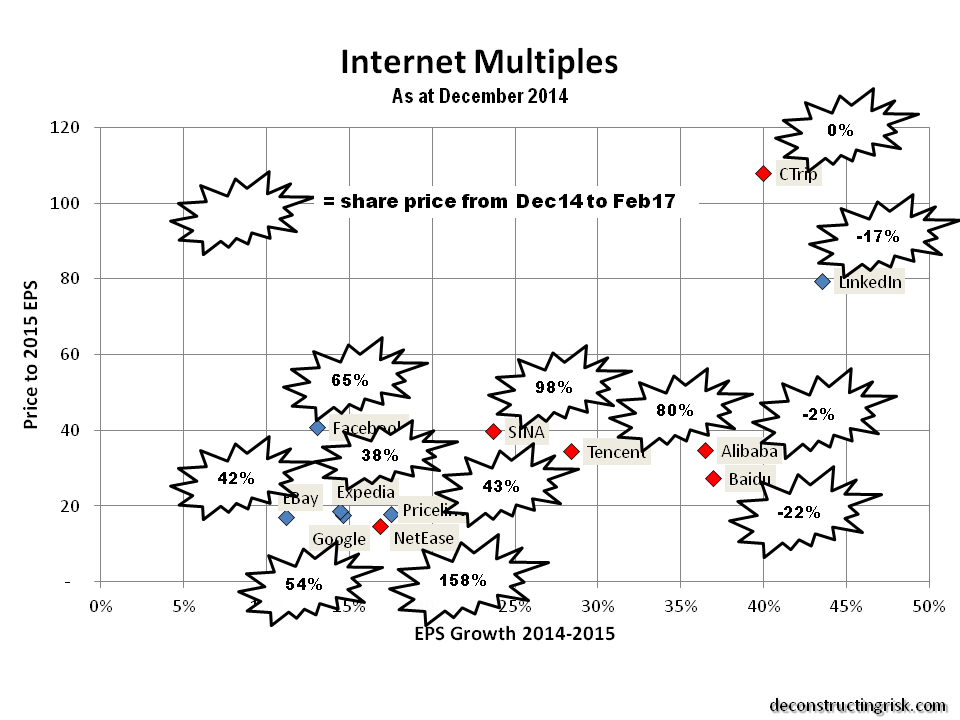
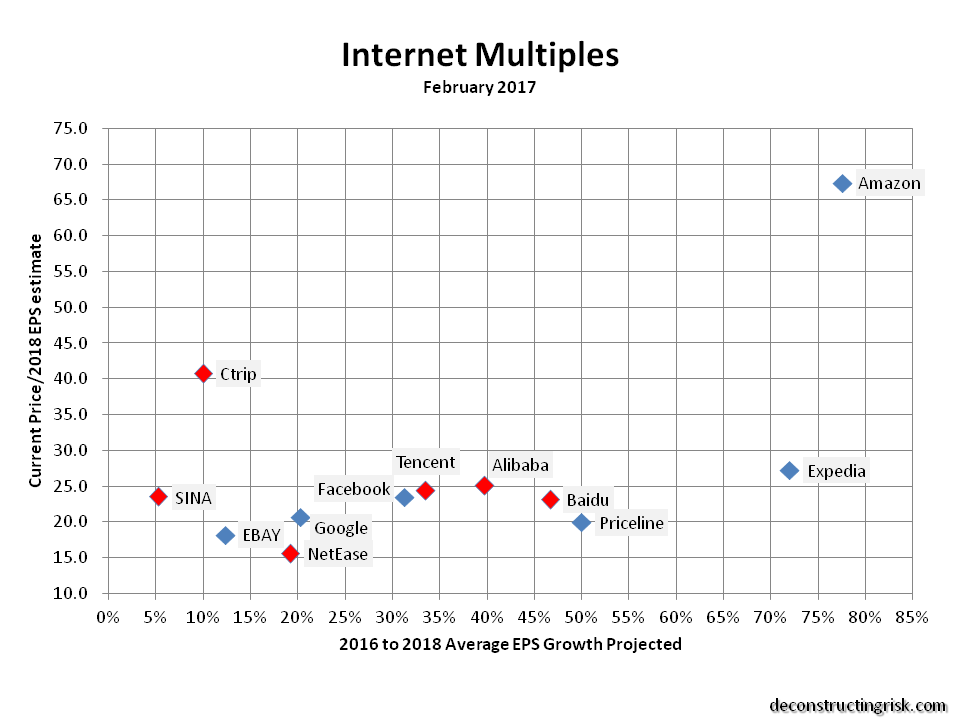
The disappointing results from Pearson Plc two weeks ago reminded me of my last post on the technological changes disrupting the education sector. I thought I would have a quick look over some of the firms mentioned in that post three years on. The trends at Pearson are not pretty, as the graph below shows. Particular poor results in the US higher education sector mean the firm is selling off Penguin Random House and “taking more radical action to accelerate our shift to digital models and to keep reshaping our business”. Pearson’s stock is down over 50% since my last post three years ago and another shakeup in management, if not strategy, looks inevitable.

click to enlargepearson-plc

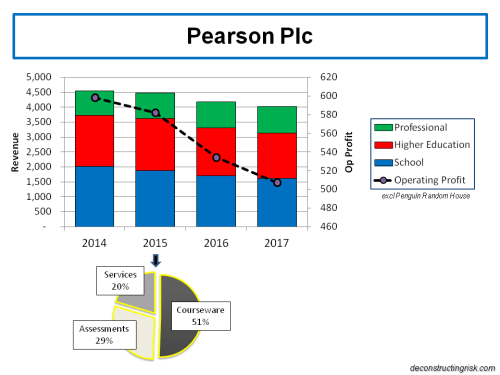
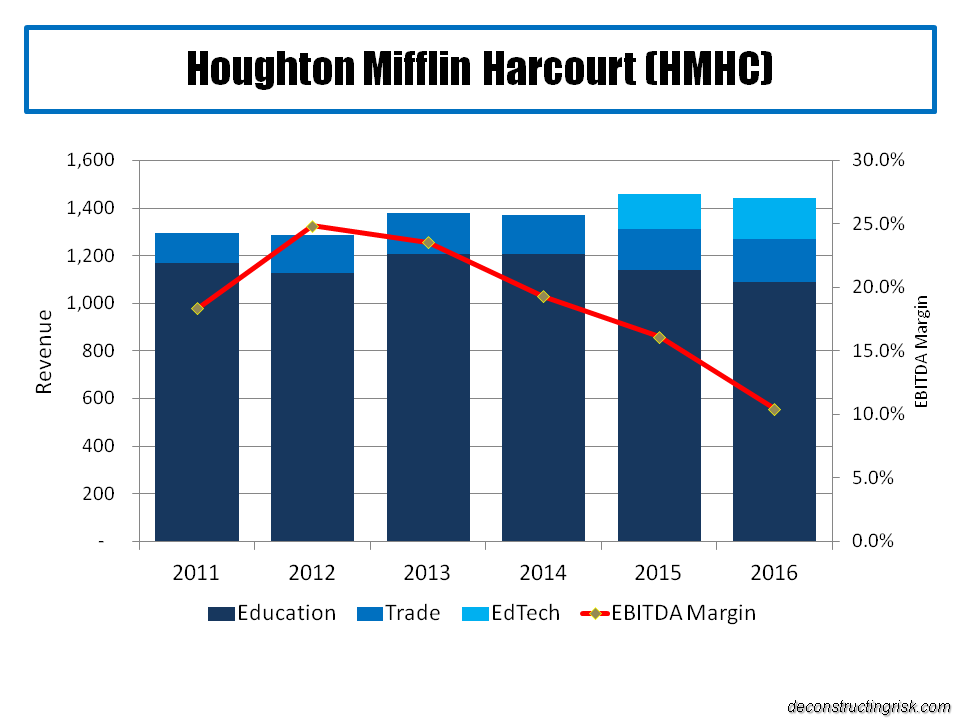
In fact the hope that the juicy margins of the old world text book business can be transferred to the new on-line world is looking fanciful. The shift to on-line education looks like another example of technology gutting the margins of yesteryear’s reliable business models. Houghton Mifflin Harcourt (HMHC) has a younger school focus and was the main education stock featured in my 2014 post. HMHC too is down considerably over the past three years, approx 42%. The graph below shows the downward trend in its core revenues and margins.

click to enlargehoughton-mifflin-harcourt-2011-to-2016-revenue-ebitda-margin

So it looks like hoping established education firms can transition with seamless profits into the digital world is not a place to look for new investment ideas. Of course, there have been big successes in the online sphere from newer firms and business models. TAL Education (ticker TAL), the Chinese K12 after school online tutor, is one and it’s up approx 250% over the past three years. It’s outside of my risk appetite as I prefer large diverse established firms with a clear market advantage, an understandable reason for upside and a management team I can believe in to entrust my optimism.

The search for new ideas goes on…

PS – Any ideas out there would be greatly welcome!