Category Archives: Insurance Market

Lessons from Lloyds

There is little doubt that the financial services industry is currently facing many challenges and undergoing a generational change. The US economist Thomas Philippon opined that the finance industry over-expansion in the US means that it’s share of GDP is about 2 percentage points higher than it needs to be although he has also estimated that the unit cost of intermediation hasn’t changed significantly in recent years, despite advances in technology and the regulatory assaults upon the industry following the financial crisis.

The insurance sector has its own share of issues. Ongoing low interest rates and inflation, broader low risk premia across the capital markets, rapid technology changes such as big data and the onset of real time underwriting are just the obvious items. The Economist had an article in March that highlighted the prospective impact of data monitoring and technology on the underwriting of motor and health risks. This is another interesting post on a number of the new peer to peer business models such as Friendsurance, Bought by Many, and Guevara who are trying to disrupt the insurance sector. There can be little doubt that the insurance industry, just like other financial sectors, will be impacted by such secular trends.

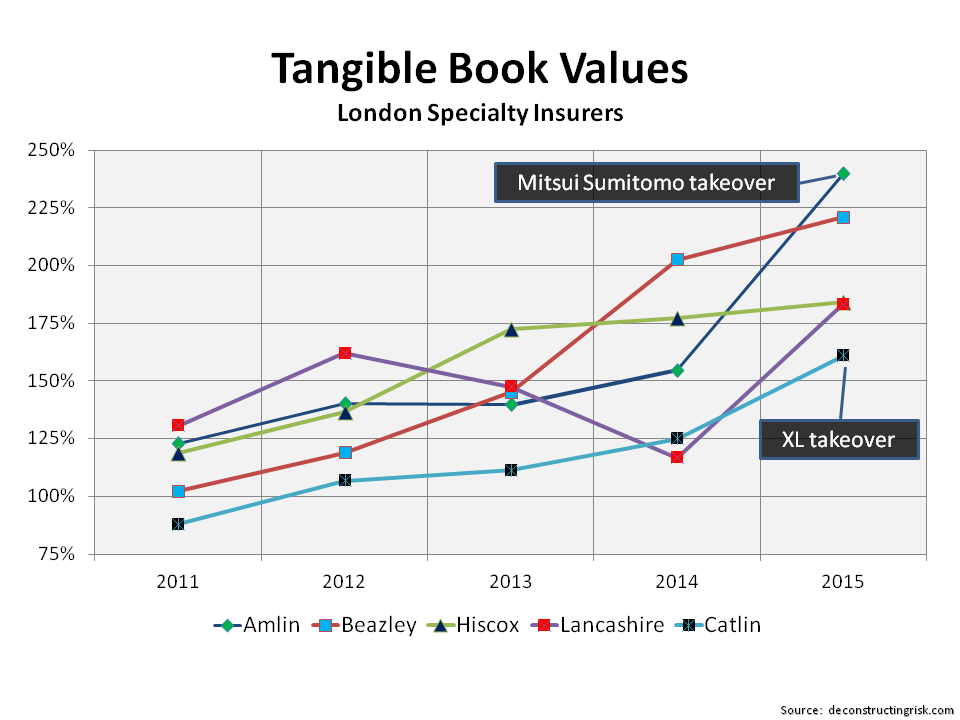
However, this post is primarily focused on the short to medium term outlook for the specialty insurance and reinsurance sector. I have been asked a few of times by readers to outline what I think the next few years may look like for this sector. My views of the current market were nicely articulated by Alex Maloney, the Group CEO of Lancashire, who commented in their recent quarterly results statement as follows:

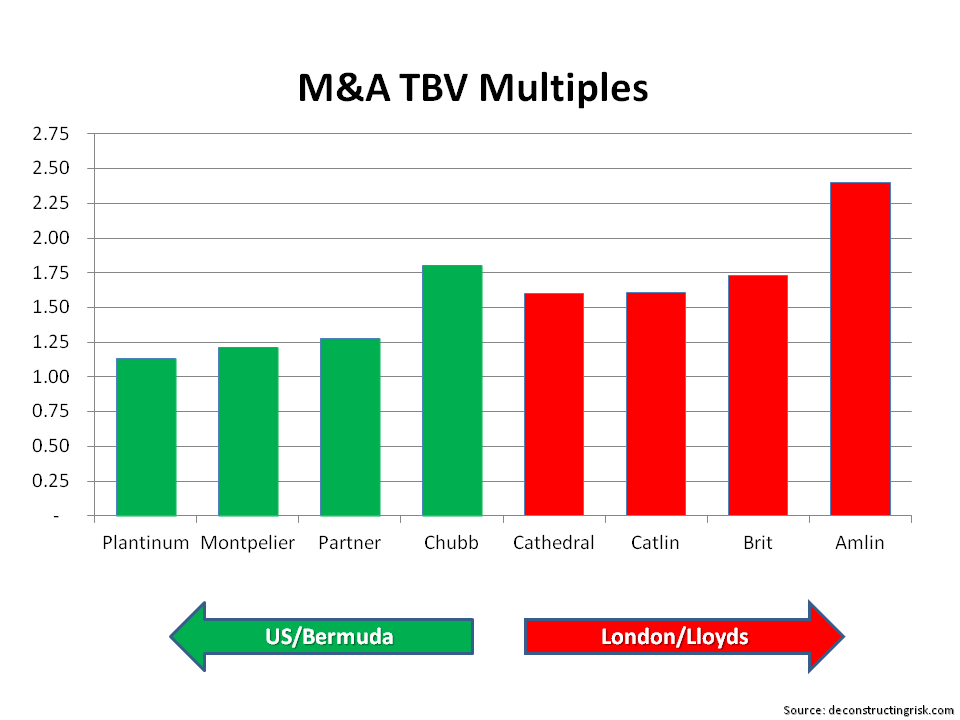
“The year to date has seen a flurry of activity on the M&A front within the industry, much of this, in my view, is driven by the need to rationalise and refocus oversized and over stretched businesses. We also continue to see a bout of initiatives and innovations in the market, the sustainability and longer term viability of which are questionable. These are symptoms of where we are in the cycle. We have seen these types of trends before and in all likelihood, will see them again.”

Lloyds of London has had a colourful past and many of its historical issues are specific to it and reflective of its own eccentric ways. However, as a proxy for the global specialty sector, particularly over the past 20 years, it provides some interesting context on the trends we find ourselves in today. Using data from Lloyds with some added flavour from my experiences, the graphic below shows the dramatic history of the market since 1950.

click to enlargeLloyds Historical Results 1950 to 2015

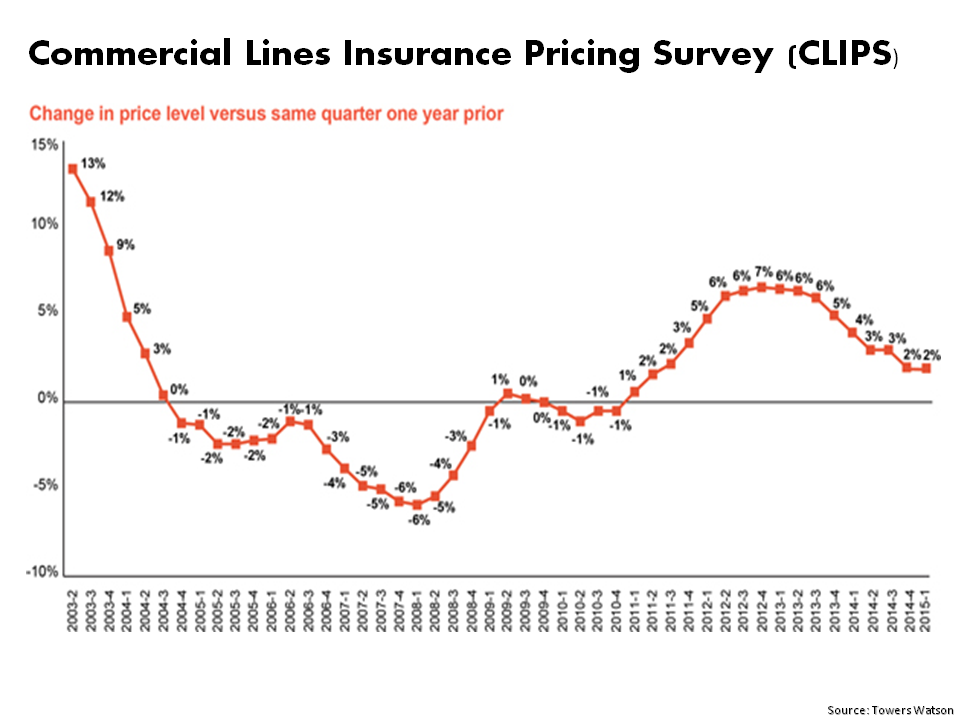
The impact of Hurricane Betsy in 1965 upon Lloyds illustrated a number of the fault-lines in the structure of Lloyds with the subsequent Cromer report warning on the future danger of unequal treatment between insiders (aka working Names) and “dumb” capital providers (aka all other Names). The rapid influx of such ill informed capital in the late 1970s and the 1980s laid the seeds of the market’s near destruction largely due to the tsunami of US liability claims resulting from asbestos and pollution exposures in the 1980s. These losses were exacerbated by the way Lloyds closed underwriting years to future capital providers through vastly underpriced reinsurance to close transactions and the practice of the incestuous placement of excess of loss retrocession for catastrophe losses within the market, otherwise known as the London Market Excess of Loss (LMX) spiral. There is a clever article by Joy Schwartzman from 2008 on the similarity between the LMX spiral and the financial risk transformational illusions that featured heavily in the financial crisis. Indeed, the losses from the sloppy “occurrence” liability insurance policy wordings and the tragedy of unheeded asbestos risks continued to escalate well into the 1990s, as the exhibit below from a 2013 Towers Watson update illustrates.

click to enlargeTowers Watson Asbestos Claims US P&C Insurers

What happened in Lloyds after the market settlement with Names and the creation of the “bad bank” Equitas for the 1992 and prior losses is where the lessons of Lloyds are most applicable to the market today. The graphic below shows the geographical and business split of Lloyds over the past 20 years, showing that although the underlying risk and geographical mix has changed it remains a diversified global business.

click to enlargeLloyds of London Historical Geographical & Sector Split

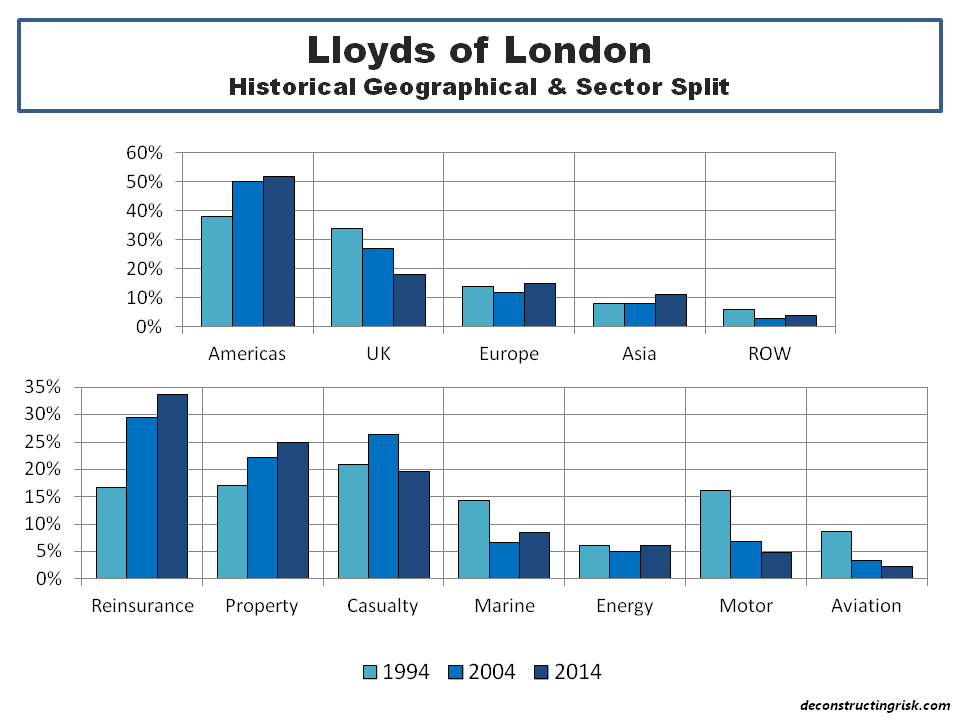
Released from the burden of the past after the creation of Equitas, the market quickly went on what can only be described as an orgy of indiscipline. The pricing competition was brutal in the last half of the 1990s with terms and conditions dramatically widened. Rating indices published by the market, as below, at the time show the extent of the rate decreases although the now abandoned underwriting indices published at the same time spectacularly failed to show the impact of the loosening of T&Cs.

click to enlargeLloyds of London Rating Indices 1992 to 1999

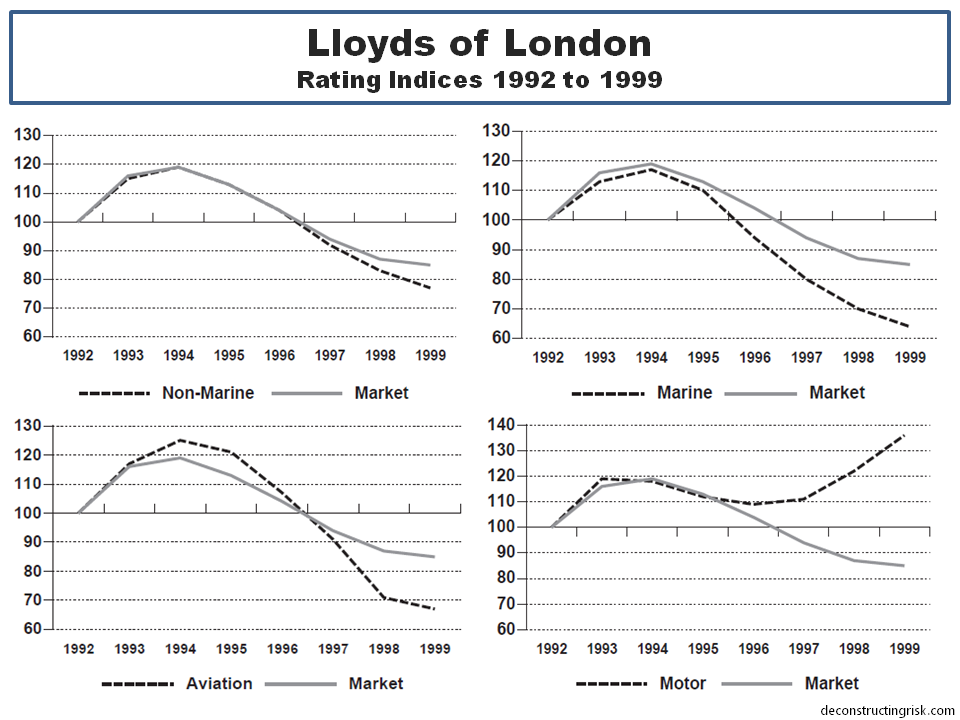
As Lloyds moved from their historical three year accounting basis in the 2000s it’s difficult to compare historical ratios from the 1990s. Notwithstanding this, I did made an attempt to reconcile combined ratios from the 1990s in the exhibit below which clearly illustrates the impact market conditions had on underwriting results.

click to enlargeLloyds of London historical combined ratio breakdown

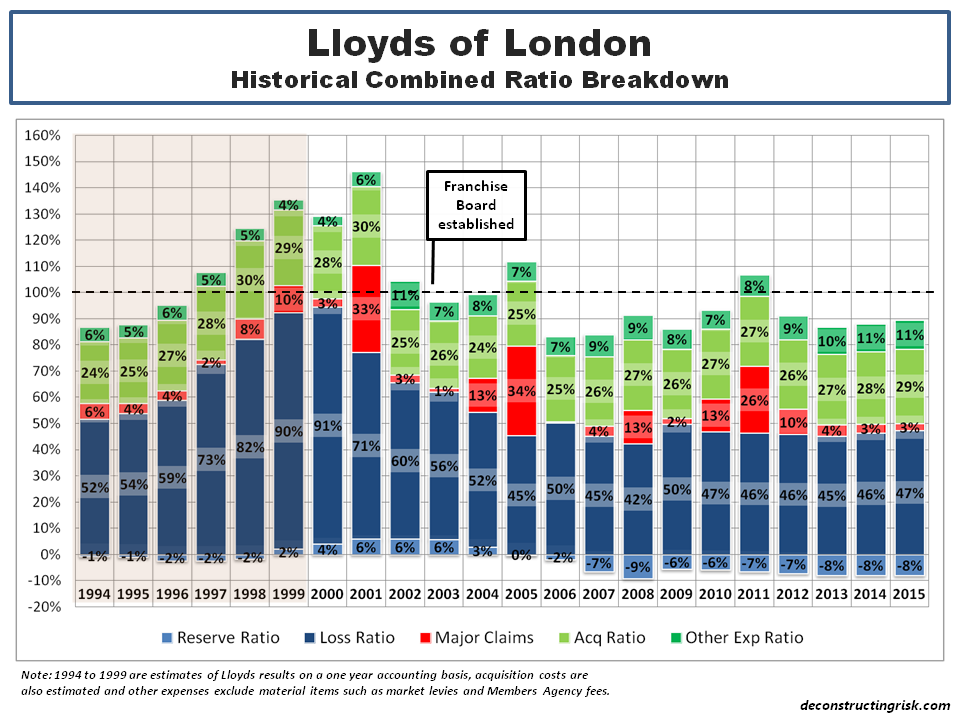
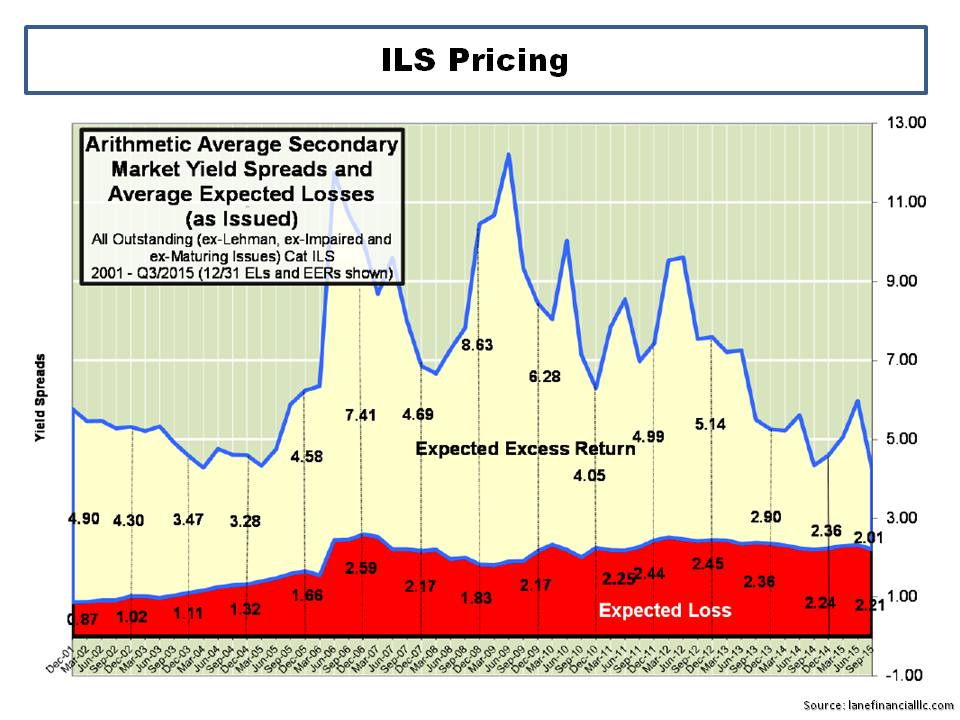
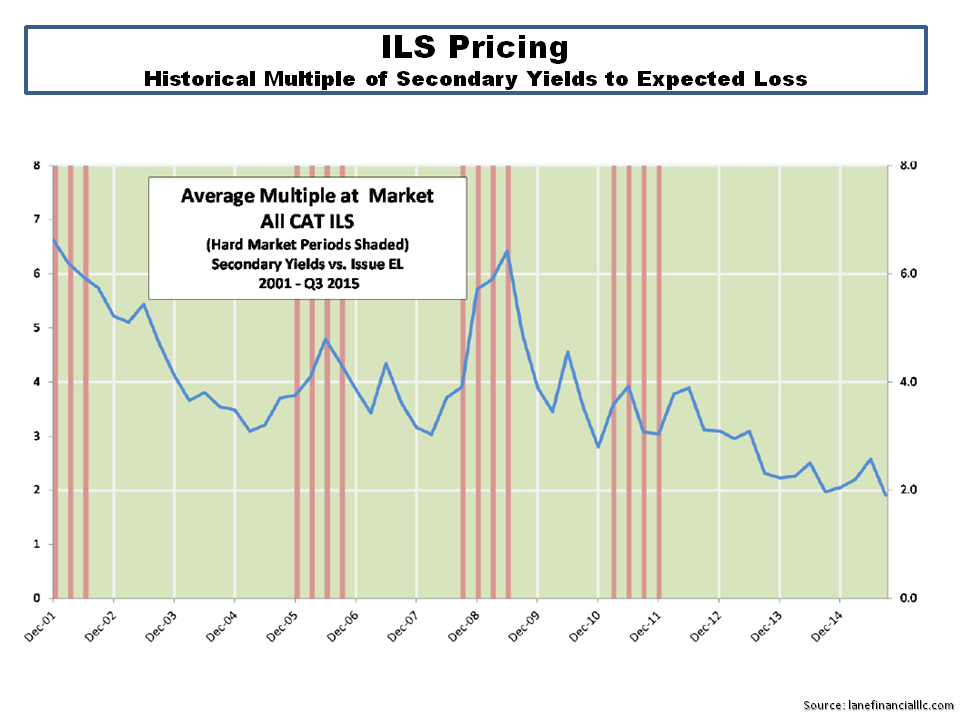
The Franchise Board established in 2003, under the leadership of the forthright and highly effective Rolf Tolle, was created to enforce market discipline in Lloyds after the disastrous 1990s. The combined ratios from recent years illustrate the impact it has had on results although the hard market after 9/11 provided much of the impetus. The real test of the Franchise Board will be outcome of the current soft market. The rating indices published by Amlin, as below, show where rates are currently compared to the rates in 2002 (which were pushed up to a level following 2001 to recover most of the 1990s fall-off). Rating indices published by Lancashire also confirm rate decreases of 20%+ since 2012 in lines like US property catastrophe, energy and aviation.

click to enlargeLloyds of London Rating Indices 2002 to 2015

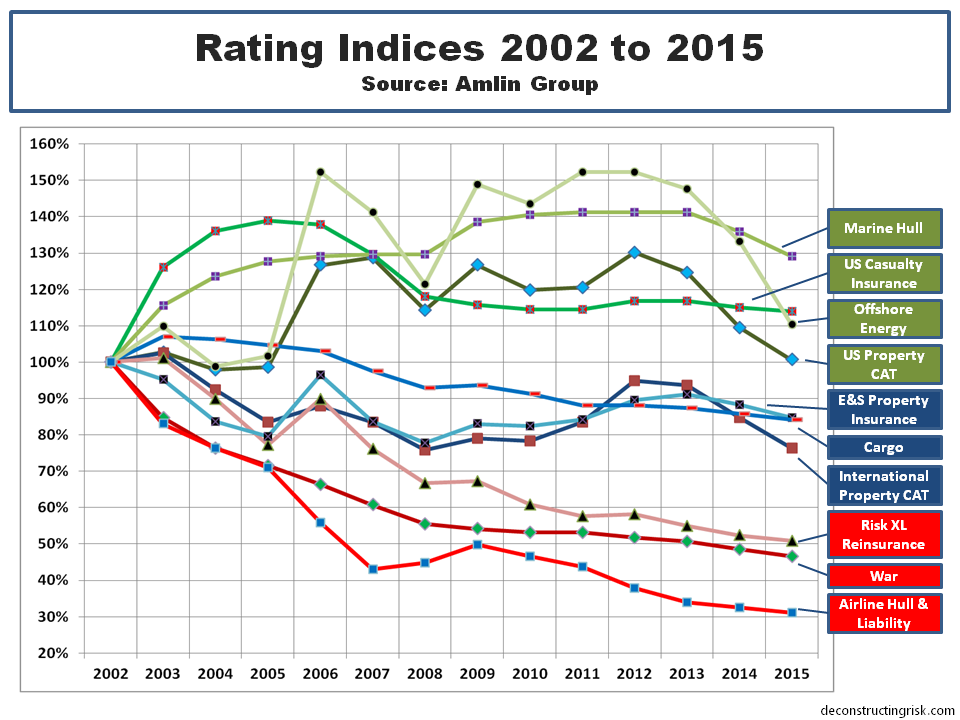
The macro-economic environment and benign claims inflation over the past several years has clearly helped loss ratios. A breakdown of the recent reserve releases, as below, show that reinsurance and property remain important sources of releases (the reinsurance releases are also heavily dependent on property lines).

click to enlargeLloyds of London Reserve Release Breakdown 2004 to 2014

Better discipline and risk management have clearly played their part in the 10 year average ROE of 15% (covering 2005 to 2014 with the 2005 and 2011 catastrophe years included). The increasing overhead expenses are an issue for Lloyds, recently causing Ed Noonan of Validus to comment:

“We think that Lloyd’s remains an outstanding market for specialty business and their thrust towards international diversification is spot on from a strategic perspective. However, the costs associated with Lloyd’s and the excessive regulation in the UK are becoming significant issues, as is the amount of management and Board time spent on compliance well beyond what’s necessary to ensure a solvent and properly functioning market. Ultimately, this smothering regulatory blanket will drive business out of Lloyd’s and further the trend of placement in local markets.”

So what does all of this tell us about the next few years? Pricing and relaxed terms and conditions will inevitably have an impact, reserve releases will dry up particularly from reinsurance and property, investment returns may improve and claim inflation may increase but neither materially so, firms will focus on expense reduction whilst dealing with more intrusive regulation, and the recent run of low catastrophic losses will not last. ROEs of low double digits or high single digits does not, in my view, compensate for these risks. Longer term the market faces structural changes, in the interim it faces a struggle to deliver a sensible risk adjusted return.

Low risk premia and leverage

The buzz from the annual insurance speed dating festival in Monte Carlo last week seems to have been subdued. Amid all the gossip about the M&A bubble, insurers and reinsurers tried to talk up a slowing of the rate of price decreases. Matt Weber of Swiss Re said “We’ve seen a slowing down of price decreases, although prices are not yet stable. We believe the trend will continue and we’ll see a stabilisation very soon”. However, analysts are not so sure. Moody’s stated that “despite strong signs that a more rational marketplace is emerging in terms of pricing, the expansion of alternative capital markets continues to threaten the traditional reinsurance business models”.  Fitch commented that “a number of fundamental factors that influence pricing remain negative” and that “some reinsurers view defending market share by writing business below the technical price floor as being an acceptable risk”. KBW comment that on-going pricing pressures will “eventually compressing underwriting margins below acceptable returns”.

It is no surprise then that much of the official comments from firms focused on new markets and innovation. Moody’s states that “innovation is a defence against ongoing disintermediation, which is likely to become more pronounced in areas in which reinsurers are not able to maintain proprietary expertise”. Munich Re cited developing new forms of reinsurance cover and partnering with hi-tech industries to create covers for emerging risks in high growth industries. Aon Benfield highlighted three areas of potential growth – products based upon advanced data and analytics (for example in wider indemnification for financial institutions or pharmaceuticals), emerging risks such as cyber, and covering risks currently covered by public pools (like flood or mortgage credit). Others think the whole business model will change fundamentally. Stephan Ruoff of Tokio Millennium Re said “the traditional insurance and reinsurance value chain is breaking up and transforming”. Robert DeRose of AM Best commented that reinsurers “will have a greater transformer capital markets operation”.

Back in April 2013, I posed the question of whether financial innovation always ends in reduced risk premia (here). The risk adjusted ROE today from a well spread portfolio of property catastrophe business is reportingly somewhere between 6% and 12% today (depending upon who you ask and on how they calculate risk adjusted capital). Although I’d be inclined to believe more in the lower range, the results are likely near or below the cost of capital for most reinsurers. That leads you to the magic of diversification and the over hyped “non-correlated” feature of certain insurance risks to other asset classes. There’s little point in reiterating my views on those arguments as per previous posts here, here and here.

In the last post cited above, I commented that “the use by insurers of their economic capital models for reinsurance/retrocession purchases is a trend that is only going to increase as we enter into the risk based solvency world under Solvency II”. Dennis Sugrue of S&P said “we take some comfort from the strength of European reinsurers’ capital modelling capabilities”, which can’t but enhance the reputation of regulatory approved models under Solvency II. Some ILS funds, such as Twelve Capital, have set up subordinated debt funds in anticipation of the demand for regulatory capital (and provide a good comparison of sub-debt and reinsurance here).

One interesting piece of news from Monte Carlo was the establishment of a fund by Guy Carpenter and a new firm founded by ex-PwC partners called Vario Partners. Vario states on their website they were “established to increase the options to insurers looking to optimise capital in a post-Solvency II environment” and are proposing private bonds with collateral structured as quota share type arrangements with loss trigger points at 1-in-100 or 1-in-200 probabilities. I am guessing that the objective of the capital relief focussed structures, which presumably will use Vario proprietary modelling capabilities, is to allow investors a return by offering insurers an ability to leverage capital. As their website saysthe highest RoE is one where the insurer’s shareholders’ equity is geared the most, and therefore [capital] at it’s thinnest”. The sponsors claim that the potential for these bonds could be six times that of the cat bond market. The prospects of allowing capital markets easy access to the large quota share market could add to the woes of the current reinsurance business model.

Low risk premia and leverage. Now that’s a good mix and, by all accounts, the future.

Follow-on (13th October 2015): Below are two graphs from the Q3 report from Lane Financial LLC which highlight the reduced risk premia prevalent in the ILS public cat bond market.

click to enlargeILS Pricing September 2015

click to enlargeILS Price Multiples September 2015

Hot Take-outs

In many episodes of fervent investment activity within a particular hot spot, like the current insurance M&A party, there is a point where you think “really?”. The deal by Mitsui Sumitomo to take over Amlin at 2.4 times tangible book is one such moment. A takeover of Amlin was predicted by analysts, as per this post, so that’s no surprise but the price is.

With the usual caveat on the need to be careful when comparing multiples for US, Bermuda, London and European insurers given the different accounting standards, the graph below from a December post, shows the historical tangible book value levels and the improving multiples being applied by the market to London firms such as Amlin.

click to enlargeHistorical Tangible Book Multiples for Reinsurers & Specialty Insurers

Comparable multiples from recent deals, as per the graph below, show the high multiple of the Mitsui/Amlin deal. Amlin has a 10 year average ROE around 20% but a more realistic measure is the recent 5 year average of 11%. In today’s market, the short to medium term ROE expectation is likely to be in the high single digits. Even at 10%, the 2.4 multiple looks aggressive.

click to enlargeM&A Tangible Book Multiples September 2015

There is little doubt that the insurance M&A party will continue and that the multiples may be racy. In the London market, the remaining independent players are getting valued as such, as per the graph below tracking valuations at points in time.

click to enlargeLondon Specialty Insurers Tangible Book Values

When the hangover comes, a 2.4 multiple will look even sillier than its does now at this point in the pricing cycle. In the meantime, its party like 1999 time!

Stressing the scenario testing

Scenario and stress testing by financial regulators has become a common supervisory tool since the financial crisis. The EU, the US and the UK all now regularly stress their banks using detailed adverse scenarios. In a recent presentation, Moody’s Analytics illustrated the variation in some of the metrics in the adverse scenarios used in recent tests by regulators, as per the graphic below of the peak to trough fall in real GDP.

click to enlargeBanking Stress Tests

Many commentators have criticized these tests for their inconsistency and flawed methodology while pointing out the political conflict many regulators with responsibility for financial stability have. They cannot be seen to be promoting a draconian scenario for stress testing on the one hand whilst assuring markets of the stability of the system on the other hand.

The EU tests have particularly had a credibility problem given the political difficulties in really stressing possible scenarios (hello, a Euro break-up?). An article last year by Morris Goldstein stated:

“By refusing to include a rigorous leverage ratio test, by allowing banks to artificially inflate bank capital, by engaging in wholesale monkey business with tax deferred assets, and also by ruling out a deflation scenario, the ECB produced estimates of the aggregate capital shortfall and a country pattern of bank failures that are not believable.”

In a report from the Adam Smith Institute in July, Kevin Dowd (a vocal critic of the regulator’s approach) stated that the Bank of England’s 2014 tests were lacking in credibility and “that the Bank’s risk models are worse than useless because they give false risk comfort”. Dowd points to the US where the annual Comprehensive Capital Assessment and Review (CCAR) tests have been supplemented by the DFAST tests mandated under Dodd Frank (these use a more standard approach to provide relative tests between banks). In the US, the whole process has been turned into a vast and expensive industry with consultants (many of them ex-regulators!) making a fortune on ever increasing compliance requirements. The end result may be that the original objectives have been somewhat lost.

According to a report from a duo of Columba University professors, banks have learned to game the system whereby “outcomes have become more predictable and therefore arguably less informative”. The worry here is that, to ensure a consistent application across the sector, regulators have been captured by their models and are perpetuating group think by dictating “good” and “bad” business models. Whatever about the dangers of the free market dictating optimal business models (and Lord knows there’s plenty of evidence on that subject!!), relying on regulators to do so is, well, scary.

To my way of thinking, the underlying issue here results from the systemic “too big to fail” nature of many regulated firms. Capitalism is (supposedly!) based upon punishing imprudent risk taking through the threat of bankruptcy and therefore we should be encouraging a diverse range of business models with sensible sizes that don’t, individually or in clusters, threaten financial stability.

On the merits of using stress testing for banks, Dowd quipped that “it is surely better to have no radar at all than a blind one that no-one can rely upon” and concluded that the Bank of England should, rather harshly in my view, scrap the whole process. Although I agree with many of the criticisms, I think the process does have merit. To be fair, many regulators understand the limitations of the approach. Recently Deputy Governor Jon Cunliffe of the Bank of England admitted the fragilities of some of their testing and stated that “a development of this approach would be to use stress testing more counter-cyclically”.

The insurance sector, particularly the non-life sector, has a longer history with stress and scenario testing. Lloyds of London has long required its syndicates to run mandatory realistic disaster scenarios (RDS), primarily focussed on known natural and man-made events. The most recent RDS are set out in the exhibit below.

click to enlargeLloyds Realistic Disaster Scenarios 2015

A valid criticism of the RDS approach is that insurers know what to expect and are therefore able to game the system. Risk models such as the commercial catastrophe models sold by firms like RMS and AIR have proven ever adapt at running historical or theoretical scenarios through today’s modern exposures to get estimates of losses to insurers. The difficulty comes in assigning probabilities to known natural events where the historical data is only really reliable for the past 100 years or so and where man-made events in the modern world, such as terrorism or cyber risks, are virtually impossible to predict. I previously highlighted some of the concerns on the methodology used in many models (e.g. on correlation here and VaR here) used to assess insurance capital which have now been embedded into the new European regulatory framework Solvency II, calibrated at a 1-in-200 year level.

The Prudential Regulatory Authority (PRA), now part of the Bank of England, detailed a set of scenarios last month to stress test its non-life insurance sector in 2015. The detail of these tests is summarised in the exhibit below.

click to enlargePRA General Insurance Stress Test 2015

Robert Childs, the chairman of the Hiscox group, raised some eye brows by saying the PRA tests did not go far enough and called for a war game type exercise to see “how a serious catastrophe may play out”. Childs proposed that such an exercise would mean that regulators would have the confidence in industry to get on with dealing with the aftermath of any such catastrophe without undue fussing from the authorities.

An efficient insurance sector is important to economic growth and development by facilitating trade and commerce through risk mitigation and dispersion, thereby allowing firms to more effectively allocate capital to productive means. Too much “fussing” by regulators through overly conservative capital requirements, maybe resulting from overtly pessimistic stress tests, can result in economic growth being impinged by excess cost. However, given the movement globally towards larger insurers, which in my view will accelerate under Solvency II given its unrestricted credit for diversification, the regulator’s focus on financial stability and the experiences in banking mean that fussy regulation will be in vogue for some time to come.

The scenarios selected by the PRA are interesting in that the focus for known natural catastrophes is on a frequency of large events as opposed to an emphasis on severity in the Lloyds’ RDS. It’s arguable that the probability of the 2 major European storms in one year or 3 US storms in one year is significantly more remote than the 1 in 200 probability level at which capital is set under Solvency II. One of the more interesting scenarios is the reverse stress test such that the firm becomes unviable. I am sure many firms will select a combination of events with an implied probability of all occurring with one year so remote as to be impossible. Or select some ultra extreme events such as the Cumbre Vieja mega-tsunami (as per this post). A lack of imagination in looking at different scenarios would be a pity as good risk management should be open to really testing portfolios rather than running through the same old known events.

New scenarios are constantly being suggested by researchers. Swiss Re recently published a paper on a reoccurrence of the New Madrid cluster of earthquakes of 1811/1812 which they estimated could result in $300 billion of losses of which 50% would be insured (breakdown as per the exhibit below). Swiss Re estimates the probability of such an event at 1 in 500 years or roughly a 10% chance of occurrence within the next 50 years.

click to enlarge1811 New Madrid Earthquakes repeated

Another interesting scenario, developed by the University of Cambridge and Lloyds, which is technologically possible, is a cyber attack on the US power grid (in this report). There have been a growing number of cases of hacking into power grids in the US and Europe which make this scenario ever more real. The authors estimate the event at a 1 in 200 year probability and detail three scenarios (S1, S2, and the extreme X1) with insured losses ranging from $20 billion to $70 billion, as per the exhibit below. These figures are far greater than the probable maximum loss (PML) estimated for the sector by a March UK industry report (as per this post).

click to enlargeCyber Blackout Scenario

I think it will be a very long time before any insurer willingly publishes the results of scenarios that could cause it to be in financial difficulty. I may be naive but I think that is a pity because insurance is a risk business and increased transparency could only lead to more efficient capital allocations across the sector. Everybody claiming that they can survive any foreseeable event up to a notional probability of occurrence (such as 1 in 200 years) can only lead to misplaced solace. History shows us that, in the real world, risk has a habit of surprising, and not in a good way. Imaginative stress and scenario testing, performed in an efficient and transparent way, may help to lessen the surprise. Nothing however can change the fact that the “unknown unknowns” will always remain.

Insurers keep on swinging

In a previous post, I compared the M&A action in the reinsurance and specialty insurance space to a rush for the bowl of keys in a swingers party. Well, the ACE/Chubb deal has brought the party to a new level where anything seems possible. The only rule now seems to be a size restriction to avoid a G-SIFI label (although MetLife and certain US stakeholders are fighting to water down those proposals for insurers).

I expanded the number of insurers in my pool for an update of the tangible book multiples (see previous post from December) as per the graphic below. As always, these figures come with a health warning in that care needs to be taken when comparing US, European and UK firms due to the differing accounting treatment (for example I have kept the present value of future profits as a tangible item). I estimated the 2015 ROE based upon Q1 results and my view of the current market for the 2011 to 2015 average.

click to enlargeReinsurers & Specialty Insurers NTA Multiples July 2015

I am not knowledgeable enough to speculate on who may be the most likely next couplings (for what its worth, regular readers will know I think Lancashire will be a target at some stage). This article outlines who Eamonn Flanagan at Shore Capital thinks is next, with Amlin being his top pick. What is clear is that the valuation of many players is primarily based upon their M&A potential rather than the underlying operating results given pricing in the market. Reinsurance pricing seems to have stabilised although I suspect policy terms & conditions remains an area of concern. On the commercial insurance side, reports from market participants like Lockton (see here) and Towers Watson (see graph below) show an ever competitive market.

click to enlargeCommercial Lines Insurance Pricing Survey Towers Watson Q1 2015

Experience has thought me that pricing is the key to future results for insurers and, although the market is much more disciplined than the late 1990s, I think many will be lucky to produce double-digit ROEs in the near term on an accident year basis (beware those dipping too much into the reserve pot!).

I am also nervous about the amount of unrealised gains which are inflating book values that may reverse when interest rates rise. For example, unrealised gains make up 8%, 13% and 18% of the Hartford, Zurich, and Swiss Re’s book value respectively as at Q1. So investing primarily to pick up an M&A premium seems like a mugs game to me in the current market.

M&A obviously brings considerable execution risk which may result in one plus one not equalling two. Accepting that the financial crisis hit the big guys like AIG and Hartford pretty hard, the graph below suggests that being too big may not be beautiful where average ROE (and by extension, market valuation) is the metric for beauty.

click to enlargeIs big beautiful in insurance

In fact, the graph above suggests that the $15-$25 billion range in terms of premiums may be the sweet spot for ROE. Staying as a specialist in the $2-7 billion premium range may have worked in the past but, I suspect, will be harder to replicate in the future.