Category Archives: Insurance Market

Reinsurer & Bank TBV Multiples

Given the increase in the tangible book values (TBV) of reinsurers over the past few quarters, I wanted to quickly update the graphic shown in previous posts (like this one) to see how the share price changes (generally flat over 2014 since the run-ups in 2013) over that time have impacted multiples. The graphic below is based upon a limited pool of pure reinsurers only which doesn’t include the specialty insurers (who on the LSE generally have higher multiples than their European and Bermudian brothers, as a previous post shows). As it turns out, the mounting pricing pressures in reinsurance have impacted current market values and based on Q1 TBV the multiples are therefore relatively stable since the end of 2013.

I wanted to compare the change in TBV multiples for reinsurers against those for banks, particularly for the global banks, but have not been able to get the clean data on the banking sector. The red line below is based upon data on all publically traded banks up until 2010 with adjustments made on the data from 2011 to 2014. With both sets of data, it’s difficult to include a consistent set of firms given the structural shifts and business changes in both sectors. The current diversion in trends between US & European banks is a case in point. So a health warning applies on the data.

click to enlargeReinsurers & Banks NTA Multiples June 2014

Computer says yes

Amlin reported their Q1 figures today and had some interesting comments on their reinsurance and retrocession spend that was down £50 million on the quarter (from 23% of gross premiums to 18%). Approx £20 million was due to a business line withdrawal with the remainder due to “lower rates and improved cover available on attractive terms”.

Amlin also stated “with the assistance of more sophisticated modelling, we have taken the decision to internalise a proportion of a number of programmes. Given the diversifying nature of many of our insurance classes, this has the effect of increasing mean expected profitability whilst only modestly increasing extreme tail risk.

The use by insurers of their economic capital models for reinsurance/retrocession purchases is a trend that is only going to increase as we enter into the risk based solvency world under Solvency II. Current market conditions have resulted in reinsurers being more open to offering multi-line aggregate coverage which protect against both frequency and severity with generous exposure inclusions.

It will only be a matter of time, in my opinion, before reinsurers underwrite coverage directly based upon a insurer’s own capital model, particularly when such a model has been approved by a firm’s regulator or been given the blessing of a rating agency.

Also in the future I expect that firms will more openly disclose their operating risk profiles. There was a trend a few years ago whereby firms such as Endurance (pre- Charman) and Aspen did include net risk profiles, such as those in the graphs below, in their investor presentations and supplements (despite the bad blood in the current Endurance-Aspen hostile take-over bid, at least it’s one thing they can say they have in common!).

click to enlargeOperating Risk Distributions

Unfortunately, it was a trend that did not catch on and was quickly discontinued by those firms. If insurers and reinsurers are increasingly using their internal capital models in key decision making, investors will need to insist on understanding them in more detail. A first step would be more public disclosure of the results, the assumptions, and their strengths and weaknesses.

Historical ROEs in reinsurance & specialty insurance

I was talking to an analyst last week about the returns on equity in the traditional reinsurer/specialty insurer market versus that in the ILS market. I have posted recently on the mid single digit returns currently on offer from (unlevered) ILS funds and also on the ROEs in the “traditional” market.

We couldn’t agree on what the historical ROE from the traditional market going back 20 years was so I decided to have a look at some figures. The graph below represents a simple average of a sample of firms going back to 1995. I selected a simple average rather than a weighted average as it should be a good representation of the varying business models and used operating ROEs where possible to reflect underwriting results. The number of firms in the 1990s in the sample is relatively small compared to the 2000s as many of the current firms were not around in their current form in the 1990s.

click to enlargeHistorical Reinsurer Specialty Insurer ROEs 1995 to 2013

The interesting outcome is that since 1995 the average (of the average annual operating) ROE is 10% with the 10 year average increasing from around 8%-9% to 11%-12% more recently. The volatility is obviously a function of the underlying risk (the standard deviation is 6%) although it is interesting that the recent high losses of 2005 and 2011 were not enough to push the average ROEs into negative territory. That illustrates the importance of differing business models in the sector.

Given the depressed level of risk premia across financial markets, it’s understandable that the capital markets have been attracted by a sector with an average ROE of 10%. Of course, the influx of new capital is making the average ever more unattainable. KBW are the latest market commentator who has called the relaxation of terms and conditions in reinsurance as a result of the softening market as “dangerous”. As the old underwriting adage goes – “don’t let the smell of the premium distract you from the stink of the risk”.

CaT pricing “heading for the basement”

Edward Noonan of Validus is always good copy and the Q1 conference call for Validus provided some insight into the market ahead of the important July 1 renewals. When asked by an analyst whether the catastrophe market was reaching a floor, Noonan answered that “I’m starting to think we might be heading for the basement”.

He also said “I think the truly disruptive factor in the market right now is ILS money. I made a comment that we’ve always viewed the ILS manager business behaving rationally. I can’t honestly say that (anymore with) what we’re seeing in Florida right now. I mean we have large ILS managers who are simply saying – whatever they quote we will put out a multi-hundred million dollar line at 10% less.

I have posted many times on the impact of new capital in the ILS market, more recently on the assertion that ILS funds havw a lower cost of capital. Noonan now questions whether investors in the ILS space really understand the expected loss cost as well as experienced traditional players. Getting a yield of 5% or lower now compared to 9% a few short years ago for BBB – risks is highlighted as an indication that investors lack a basic understanding of what they are buying. The growing trend of including terrorism risks in catastrophe programmes is also highlighted as a sign that the new market players are mispricing risk and lack basic understanding on issues such as a potential clash in loss definitions and wordings.

Validus highlight how they are disciplined in not renewing underpriced risk and arbitraging the market by purchasing large amounts of collaterised reinsurance and retrocession. They point to the reduction in their net risk profile by way of their declining PMLs, as the graph below of their net US wind PMLs as a percentage of net tangible assets illustrates.

This is positive provided the margins on their core portfolio don’t decrease faster than the arbitrage. For example, Validus made underwriting income in 2012 and 2013 of 6% and 17% of their respective year-end net tangible assets. The graph below also shows what the US Wind PML would be reduced by if an operating profit of 12% (my approximation of a significant loss free 2014 for Validus) could be used to offset the US Wind net losses. Continuing pricing reductions in the market could easily make a 12% operating profit look fanciful.

click to enlargeValidus Net US Wind PML as % of tangible net assets

I think that firms such as Validus are playing this market rationally and in the only way you can without withdrawing from core (albeit increasingly under-priced) markets. If risk is continually under-priced over the next 12 to 24 months, questions arise about the sustainability of many existing business models. You can outrun a train moving out of a station but eventually you run out of platform!

Pricing Pressures & Risk Profiles

There have been some interesting developments in the insurance market this week. Today, it was announced that Richard Brindle would retire from Lancashire at the end of the month. The news is not altogether unexpected as Brindle was never a CEO with his ego caught up in the business. His take it or leave it approach to underwriting and disciplined capital management are engrained in Lancashire’s DNA and given the less important role of personalities in the market today, I don’t see the sell-off of 5% today as justified. LRE is now back at Q3 2011 levels and is 25% off its peak approximately a year ago. As per a previous post, the smaller players in the specialty business face considerable challenges in this market although LRE should be better placed than most. A recent report from Willis on the energy market illustrates how over-capacity is spreading across specialist lines. Some graphs from the report are reproduced below.

click to enlargeEnergy Insurance Market Willis 2013 Review

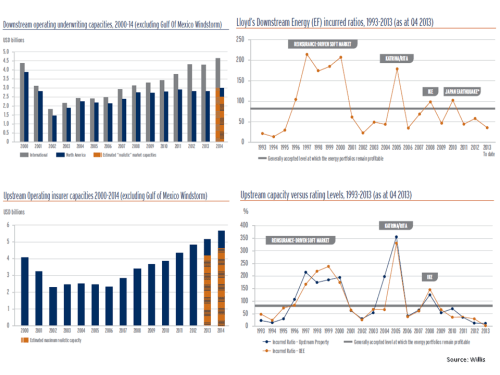
One market character who hasn’t previously had an ego check issue is John Charman and this week he revealed a hostile take-over of Aspen at a 116% of book value by his new firm Endurance Specialty. The bid was quickly rejected by Aspen with some disparaging comments about Endurance and Charman. Aspen’s management undoubtedly does not relish the prospect of having Charman as a boss. Consolidation is needed amongst the tier 2 (mainly Bermudian) players to counter over-capacity and compete in a market that is clustering around tier 1 global full service players. Although each of the tier 2 players has a different focus, there is considerable overlap in business lines like reinsurance so M&A will not be a case of one and one equalling two. To be fair to Charman the price looks reasonable at a 15% premium to Aspen’s high, particularly given the current market. It will be fascinating to see if any other bidders emerge.

After going ex-dividend, Swiss Re also took a dive of 9% this week and it too is at levels last seen a year ago. The dive was unusually deep due to the CHF7 dividend (CHF3.85 regular and CHF4.15 special). Swiss Re’s increasingly shareholder friendly policy makes it potentially attractive at its current 112% of book value. It is however not immune from the current market pricing pressures.

After doing some work recently on the impact of reducing premium rates, I built a very simple model of a portfolio of 10,000 homogeneous risks with a loss probability of 1%. Assuming perfect burning cost rating (i.e. base rate set at actual portfolio mean), the model varied the risk margin charged. I ran the portfolio through 10,000 simulations to get the resulting distributions. As the graph below shows, a decreasing risk margin not only shifts the distribution but also changes the shape of the distribution.

click to enlargeRisk Premium Reductions & Insurance Portfolio Risk Profile

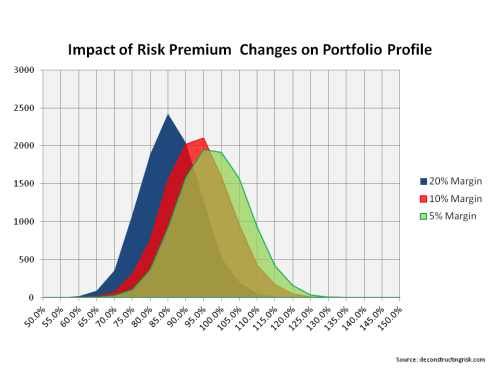
This illustrates that as premium rates decline the volatility of the portfolio also increases as there is less of a buffer to counter variability. In essence, as the market continues to soften, even with no change in loss profile, the overall portfolio risk increases. And that is why I remain cautious on buying back into the sector even with the reduced valuations of firms like Lancashire and Swiss Re.