Tag Archives: reinsurance pricing

CaT pricing “heading for the basement”

Edward Noonan of Validus is always good copy and the Q1 conference call for Validus provided some insight into the market ahead of the important July 1 renewals. When asked by an analyst whether the catastrophe market was reaching a floor, Noonan answered that “I’m starting to think we might be heading for the basement”.

He also said “I think the truly disruptive factor in the market right now is ILS money. I made a comment that we’ve always viewed the ILS manager business behaving rationally. I can’t honestly say that (anymore with) what we’re seeing in Florida right now. I mean we have large ILS managers who are simply saying – whatever they quote we will put out a multi-hundred million dollar line at 10% less.

I have posted many times on the impact of new capital in the ILS market, more recently on the assertion that ILS funds havw a lower cost of capital. Noonan now questions whether investors in the ILS space really understand the expected loss cost as well as experienced traditional players. Getting a yield of 5% or lower now compared to 9% a few short years ago for BBB – risks is highlighted as an indication that investors lack a basic understanding of what they are buying. The growing trend of including terrorism risks in catastrophe programmes is also highlighted as a sign that the new market players are mispricing risk and lack basic understanding on issues such as a potential clash in loss definitions and wordings.

Validus highlight how they are disciplined in not renewing underpriced risk and arbitraging the market by purchasing large amounts of collaterised reinsurance and retrocession. They point to the reduction in their net risk profile by way of their declining PMLs, as the graph below of their net US wind PMLs as a percentage of net tangible assets illustrates.

This is positive provided the margins on their core portfolio don’t decrease faster than the arbitrage. For example, Validus made underwriting income in 2012 and 2013 of 6% and 17% of their respective year-end net tangible assets. The graph below also shows what the US Wind PML would be reduced by if an operating profit of 12% (my approximation of a significant loss free 2014 for Validus) could be used to offset the US Wind net losses. Continuing pricing reductions in the market could easily make a 12% operating profit look fanciful.

click to enlargeValidus Net US Wind PML as % of tangible net assets

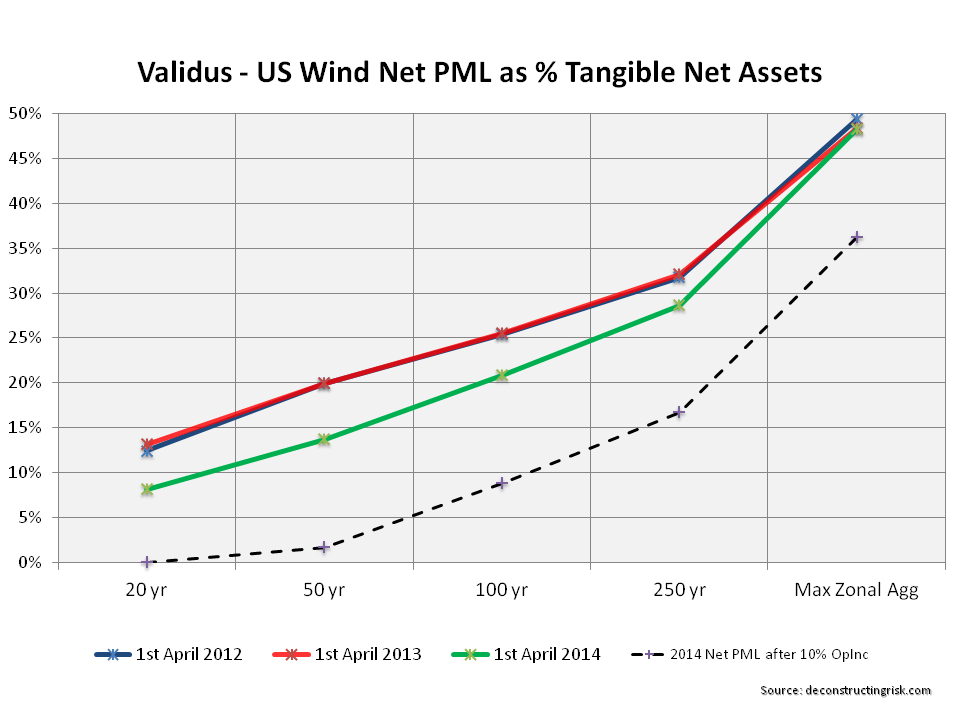
I think that firms such as Validus are playing this market rationally and in the only way you can without withdrawing from core (albeit increasingly under-priced) markets. If risk is continually under-priced over the next 12 to 24 months, questions arise about the sustainability of many existing business models. You can outrun a train moving out of a station but eventually you run out of platform!

Pricing Pressures & Risk Profiles

There have been some interesting developments in the insurance market this week. Today, it was announced that Richard Brindle would retire from Lancashire at the end of the month. The news is not altogether unexpected as Brindle was never a CEO with his ego caught up in the business. His take it or leave it approach to underwriting and disciplined capital management are engrained in Lancashire’s DNA and given the less important role of personalities in the market today, I don’t see the sell-off of 5% today as justified. LRE is now back at Q3 2011 levels and is 25% off its peak approximately a year ago. As per a previous post, the smaller players in the specialty business face considerable challenges in this market although LRE should be better placed than most. A recent report from Willis on the energy market illustrates how over-capacity is spreading across specialist lines. Some graphs from the report are reproduced below.

click to enlargeEnergy Insurance Market Willis 2013 Review

One market character who hasn’t previously had an ego check issue is John Charman and this week he revealed a hostile take-over of Aspen at a 116% of book value by his new firm Endurance Specialty. The bid was quickly rejected by Aspen with some disparaging comments about Endurance and Charman. Aspen’s management undoubtedly does not relish the prospect of having Charman as a boss. Consolidation is needed amongst the tier 2 (mainly Bermudian) players to counter over-capacity and compete in a market that is clustering around tier 1 global full service players. Although each of the tier 2 players has a different focus, there is considerable overlap in business lines like reinsurance so M&A will not be a case of one and one equalling two. To be fair to Charman the price looks reasonable at a 15% premium to Aspen’s high, particularly given the current market. It will be fascinating to see if any other bidders emerge.

After going ex-dividend, Swiss Re also took a dive of 9% this week and it too is at levels last seen a year ago. The dive was unusually deep due to the CHF7 dividend (CHF3.85 regular and CHF4.15 special). Swiss Re’s increasingly shareholder friendly policy makes it potentially attractive at its current 112% of book value. It is however not immune from the current market pricing pressures.

After doing some work recently on the impact of reducing premium rates, I built a very simple model of a portfolio of 10,000 homogeneous risks with a loss probability of 1%. Assuming perfect burning cost rating (i.e. base rate set at actual portfolio mean), the model varied the risk margin charged. I ran the portfolio through 10,000 simulations to get the resulting distributions. As the graph below shows, a decreasing risk margin not only shifts the distribution but also changes the shape of the distribution.

click to enlargeRisk Premium Reductions & Insurance Portfolio Risk Profile

This illustrates that as premium rates decline the volatility of the portfolio also increases as there is less of a buffer to counter variability. In essence, as the market continues to soften, even with no change in loss profile, the overall portfolio risk increases. And that is why I remain cautious on buying back into the sector even with the reduced valuations of firms like Lancashire and Swiss Re.

Munich’s Underwriting Cycle

Munich Re had a good set of results last week with a 12.5% return on equity on a profit of €3.3 billion (with the reinsurance business contributing €2.8 billion of the profit). A €1 billion share buyback was also announced contributing to the ongoing shareholder friendly actions by industry players. Munich is targeting €3 billion for 2014 but warned of challenges ahead including “the lingering low-interest-rate environment, increasing competition in reinsurance, and changes in demand from clients in primary insurance”.

Torsten Jeworrek, Munich Re’s Reinsurance CEO, cited tailor-made solutions as a strength for Munich highlighting “multi-year treaties (occasionally incorporating cross-line and cross-regional covers), retroactive reinsurance solutions, transactions for capital relief, comprehensive consultation on capital management, and the insurance of complex liability, credit and large industrial risks”.

Whilst looking through the 2013 report, I noticed historical calendar year combined ratios (COR) for the P&C business (reinsurance & primary) including and excluding catastrophes. I dug up these figures going back to 1991 as per the graph below. A small amount of adjustment was needed, particularly in relation to the 24.3% and 17.1% of deterioration for 2001 and 2002 relating to 9/11 losses (which I included as catastrophes in the CaT ratio for those years). As with a previous post on underwriting cycles, I then “normalised” the COR excluding catastrophes for the changes in interest rates using a crude discount measure based upon the US risk free rate for each calendar year plus 150 bps over 2.5 years. That may be conservative, particularly for the 1990s where equities were a bigger part of European’s asset portfolio. I then added the (undiscounted) CaT ratio to the discounted figures to give an idea of the historical underwriting cycle.

click to enlargeMunich Underwriting Cycle

The “normalised” average discounted COR (excluding CaT) since 1991 is 87% and the average over the past 10 years is 83%. The standard deviation for the series since 1991 is 6% and for the last 10 years 4% indicating a less volatile period in recent years in core ratios excluding catastrophes.

The average CaT ratio since 1991 is 7% versus 9% over the past 10 years. The standard deviation for the CaT ratio since 1991 is 8% and for the last 10 years 9% indicating a more volatile period in recent years in CaT ratios.

Adding the discounted CORs and the (undiscounted) CaT ratios, the average since 1991 and over the past 10 years is 95% and 92% respectively (with standard deviation of 11% and 9% respectively).

As Munich is the largest global reinsurer, the ratios (reinsurance & primary split approx 80%:20%) above represent a reasonable cross section of industry and give an average operating return of 5% to 8% depending upon the time period selected. Assuming a 0.5% risk free return today, that translates into a rough risk adjusted return as per the Sharpe ratio of 0.44 and 0.80 for the period to 1991 and over the past 10 years respectively. Although the analysis is crude and only considers operating results, these figures are not exactly earth-shattering (even if you think the future will be more like the last 10 years rather than the longer term averages!).

Such results perhaps explain the growing trend of hedge funds using reinsurance vehicles as “float” generators. If the return on assets over risk free is increased from the 150 bps assumed to 300 bps in the analysis above, the Sharpe ratios increase to more acceptable 0.73 and 1.13 respectively. And that ignores the tax benefits amongst other items!

As an aside, I again (as per this post) compared the underlying discounted COR (excluding catastrophes) from Munich against a credit index of global corporate defaults (by originating year as a percentage of the 1991 to 2013 average) in the graph below. As a proxy for the economic & business cycles, it illustrates an obvious connection.

click to enlargeMunich Underwriting & Credit Cycle

Insurance ROEs earned the hard way

Munich kicked off the year end reporting season for insurers this week with a pre-announcement of results that beat their guidance. For non-life reinsurance, low large and catastrophe losses plus 5% of prior year releases mean that the 92% combined ratio is only 1% higher than 2012 for Munich Re despite the weak pricing market.

I am expecting to see strong non-life results across the market as it looks like attritional loss ratios for 2013 are lower than average which, with low catastrophe losses, should make for low combined ratios in 2013.

For specialty nonlife insurers and reinsurers, I would expect combined ratios to come in the mid to high eighties on average with ROEs in the low to mid teens. The relatively low investment returns are hurting ROEs which in the past would of given high teens or low twenties for such underwriting ratios.

The business models of the European composite reinsurers are not as sensitive to combined ratio with the life side providing more stable earnings. I would expect most of the large composite reinsurers to come in in the low 90s or high 80s (Munich’s figure was 92%) whilst giving ROEs similar to their non-life specialty brothers in the low to mid teens.

The graph below illustrates that todays combined ratios don’t mean the high ROEs they once did (2013 figures are as at Q3).

click to enlargeInsurance ROEs and Combined Ratios 2004 to 2013


Another look across insurance cycles

Following on from a previous post on insurance cycles and other recent posts, I have been looking over the inter-relationship between insurance cycles in the US P&C market, the Lloyds of London market and the reinsurance market. Ideally, the comparisons should be done on an accident year basis (calendar year less prior year reserve movements) with catastrophic/large losses for 2001/2005/2011 excluded but I don’t (yet) have sufficient historical data to make such meaningful comparisons.

The first graph shows calendar year combined ratios in each of the three markets. The US P&C figures contain both consumer and commercial business and as a result are less volatile with the other markets. For example, Lloyds results are from specialty business classes like energy, marine, credit & surety, A&H, specialty casualty, excess and surplus (E&S) lines and reinsurance. The reinsurance ratios are those for most reinsurers as per S&P in their annual global reports. For good measure, I have also included the US real interest rates to show the impact that reduced investment income is having on the trend in combined ratios across all markets. Overall, ratios have been on a downward trend since the early 1990s. However, if catastrophic losses and reserve releases are excluded ratios have been on an upward trend since 2006 across Lloyds and the reinsurance markets. Recent rate increases in the US such as the high single digit rate increases in commercial property & workers comp (see Aon Benfield January report for details on US primary rate trends) may mean that the US P&C market comes in with a combined ratio below 100% for the full 2013 year (from 102% and 106% in 2012 and 2011 respectively).

click to enlargeInsurance Cycle Combined RatiosAs commented on above, the US P&C ratios cover consumer and commercial exposures and don’t fully show the inter-relationship between the different business classes across that market. The graph below shows the calendar year ratios in the US across the main business classes and paint a more volatile picture than the red line above.

click to enlargeUS Commercial Business Classes Combined Ratios