Category Archives: Economics

Hi there LIBOR

According to this article in the FT by Bhanu Baweja of UBS, the rise in the spread between the dollar 3-month LIBOR, now over 2.25% compared to 1.7% at the start of the year, and the overnight indexed swap (OIS) rate, as per the graph below, is a “red herring” and that “supply is at play here, not rising credit risk”. This view reflects the current market consensus, up until recently at least.

click to enlarge

Baweja argues that the spread widening is due to the increased T-bill-OIS spread because of increased yields due to widening fiscal deficits in the US and to the increased commercial paper (CP) to T-bill spread due to US company repatriations as a result of the Trump tax cuts. Although Baweja lists off the current bull arguments to be cheerful, he does acknowledge that an increasing LIBOR will impact US floating borrowers of $2.2 trillion of debt, half of whom are BB- and below, particularly if 3-month US LIBOR breaks past 3%. Baweja points to rises in term premiums as the real red flags to be looking out for.

Analysts such as Matt Smith of Citi and Jonathan Garner of Morgan Stanley are not as nonchalant as the market consensus as articulated by Baweja. The potential for unintended consequences and/or imbalances in this tightening phase, out of the greatest monetary experiment every undertaken, is on many people’s minds, including mine. I cannot but help think of a pressure cooker with every US rate rise ratcheting the heat higher.

Citi worry that LIBOR may be a 3-month leading indicator for dollar strengthening which may send shock-waves across global risk markets, particularly if FX movements are disorderly. Garner believes that “we’re already looking at a significant tightening of monetary policy in the US and in addition China is tightening monetary policy at the same time and this joint tightening is a key reason why we are so cautious on markets”. Given Chairman Powell’s debut yesterday and the more hawkish tone in relation to 2019 and 2020 tightening, I’ll leave this subject on that note.

The intricacies of credit market movements are not my area of expertise, so I’ll take council on this topic from people who know better.

Eh, help Eddie….what do you think?

A frazzled Goldilocks?

Whatever measure you look at, equities in the US are overvalued, arguably in bubble territory. Investors poured record amounts into equity funds in recent weeks as the market melt-up takes hold. One of the intriguing features of the bull market over the past 18 months has been the extraordinary low volatility. Hamish Preston of S&P Dow Jones Indices estimated that the average observed 1-month volatility in the S&P 500 in 2017 is “lower than in any other year since 1970”. To illustrate the point, the graph below shows the monthly change in the S&P500 over recent years.

click to enlarge

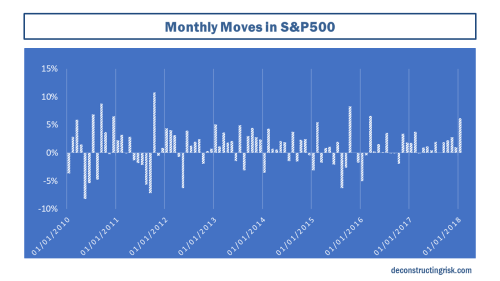
The lack of any action below 0% since November 2016 and any pullback greater than 2% since January 2016 is striking. “Don’t confuse lack of volatility with stability, ever” is a quote from Nassim Nicolas Taleb that’s seems particularly apt today.

Andrew Lapthorne of SocGen highlighted that low risk markets tend to have a big knock on effect with a “positive feedback mechanism embedded in many risk models”. In other words, the less risk is observed in the market and used as the basis for model inputs, the more risk the quant models allow investors to take! [The impact of quant models and shadow risks from passive investing and machine learning are areas I hope to explore further in a future post.]

One risk that has the potential to spoil the party in 2018 is the planned phased normalisation of monetary policy around the world after the great experimentations of recent years. The market is currently assuming that Central Banks will guarantee that Goldilocks will remain unfrazzled as they deftly steer the ship back to normality. A global “Goldilocks put” if I could plagiarize “the Greenspan put”! Or a steady move away from the existing policy that no greater an economic brain than Donald Trump summarized as being: “they’re keeping the rates down so that everything else doesn’t go down”.

The problem for Central Banks is that if inflation stays muted in the short-term and monetary policy remains loose than the asset bubbles will reach unsustainable levels and require pricking. Or alternatively, any attempt at monetary policy normalization may dramatically show how Central Banks have become the primary providers of liquidity in capital markets and that even modest tightening could result in dangerously imbalances within the now structurally dependent system.

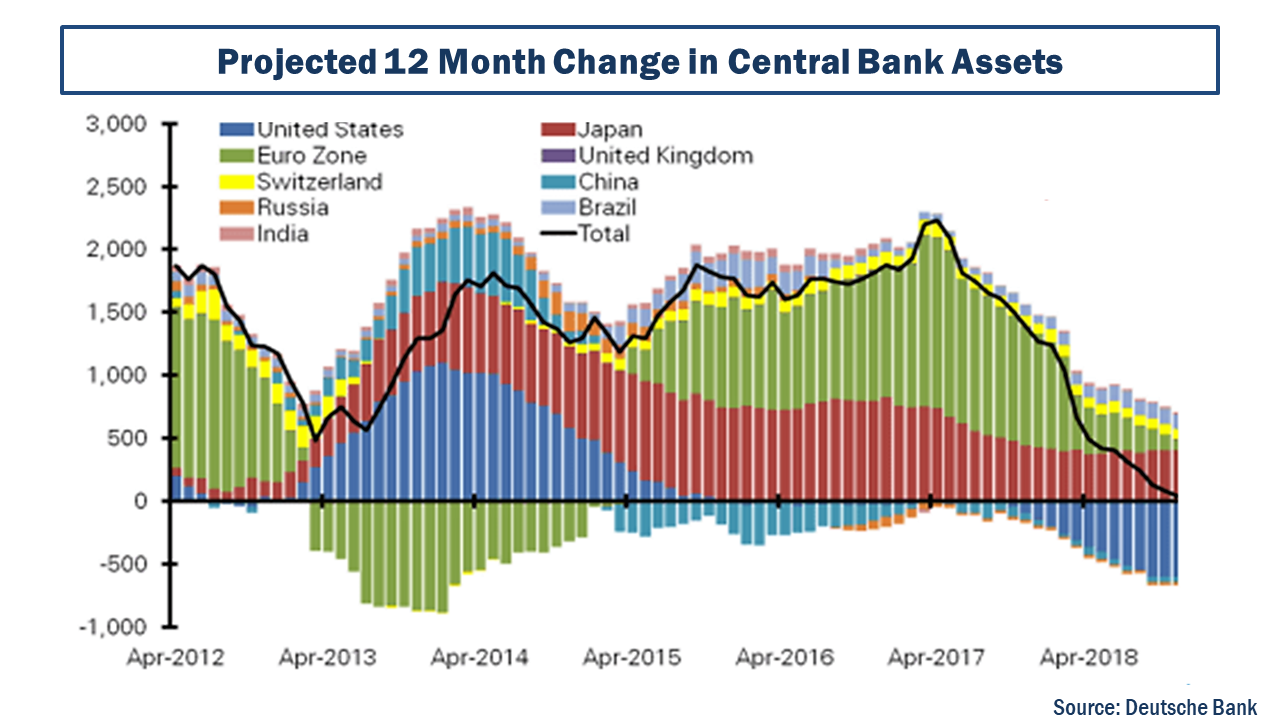
Many analysts (and the number is surprising large) have been warning for some time about the impact of QE flows tightening in 2018. These warnings have been totally ignored by the market, as the lack of volatility illustrates. For example, in June 2017, Citi’s Matt King projected future Central Bank liquidity flows and warned that a “significant unbalancing is coming“. In November 2017, Deutsche Bank’s Alan Ruskin commented that “2018 will see the world’s most important Central Bank balance sheets shift from a 12 month expansion of more than $2 trillion, to a broadly flat position by the end of 2018, assuming the Fed and ECB act according to expectations”. The projections Deutsche Bank produced are below.

click to enlarge

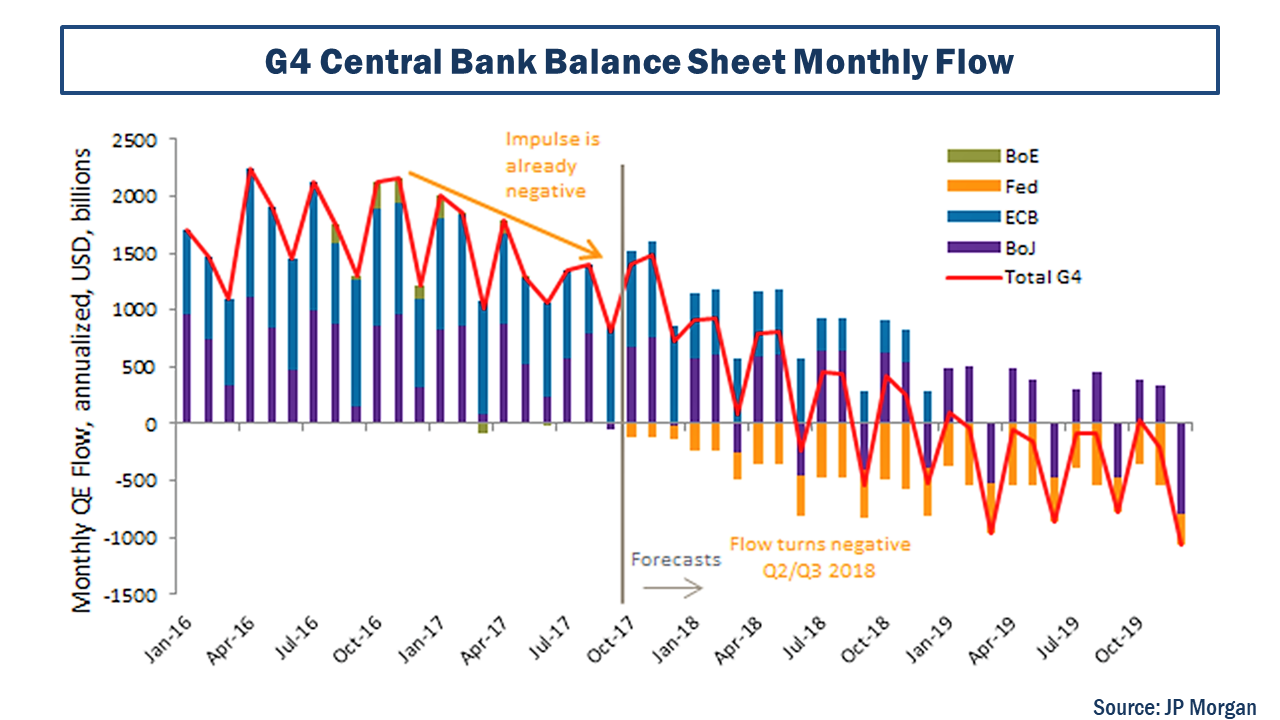
Andrew Norelli of JP Morgan Asset Management in a piece called “Stock, Flow or Impulse?” stated that “It’s still central bank balance sheets, and specifically the flow of global quantitative easing (QE) that is maintaining the buoyancy in financial asset prices”. JP Morgan’s projections of the top 4 developed countries are below.

click to enlarge

Lance Roberts of RealInvestmentAdvice.com produced an interesting graph specifically relating to the Fed’s balance sheet, as below. Caution should be taken with any upward trending metric when compared to the S&P500 in recent years!

click to enlarge

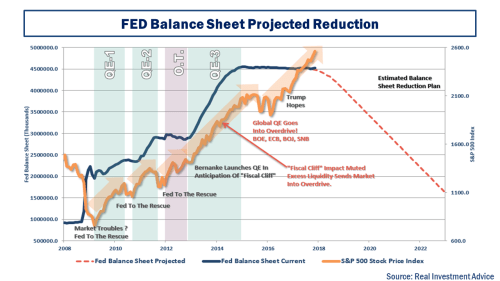
Of course, we have been at pre-taper junctions many times before and every previous jitter has been met with soothing words from Central Banks and more liquidity creation. This time though it feels different. It has to be different. Or Central Bankers risk been viewed as emperors without cloths.

The views of commentators differ widely on this topic. Most of the business media talking heads are wildly positive (as they always are) on the Goldilocks status quo. John Mauldin of MauldinEconomics.com believes the number one risk factor in the US is Fed overreach and too much tightening. Bank of America Merrill Lynch chief investment strategist Michael Hartnett, fears a 1987/1994/1998-style flash crash within the next three months caused by a withdrawal of central bank support as interest rates rise.

Christopher Cole of Artemis Capital Management, in a wonderful report called “Volatility and the Alchemy of Risk”, pulls no punches about the impact of global central banks having pumped $15 trillion in cheap money stimulus into capital markets since 2009. Cole comments that “amid this mania for investment, the stock market has begun self-cannibalizing” and draws upon the image of the ouroboros, an ancient Greek symbol of a snake eating its own tail. Cole estimates that 40% of EPS growth and 30% of US equity gains since 2009 have been as a direct result of the financial engineering use of stock buy backs. Higher interest rates, according to Cole, will be needed to combat the higher inflation that will result from this liquidity bonanza and will cut off the supply for the annual $800 billion of share buybacks. Cole also points to the impact on the high yield corporate debt market and the overall impact on corporate defaults.

Another interesting report, from a specific investment strategy perspective, is Fasanara Capital’s Francesco Filia and the cheerfully entitled “Fragile Markets On The Edge of Chaos”. As economies transition from peak QE to quantitative tightening, Filia “expect markets to face their first real crash test in 10 years” and that “only then will we know what is real and what is not in today’s markets, only then will we be able to assess how sustainable is the global synchronized GDP growth spurred by global synchronized monetary printing”. I like the graphic below from the report.

click to enlarge

I found the reaction to the Trump’s administration misstep on dollar strength interesting this week. Aditya Bhave and Ethan Harris, economists at Bank of America, said of the episode that “the Fed will see the weak dollar as a sign of easy financial conditions and a green light to keep tightening monetary policy”. ECB President Mario Draghi was not happy about the weak dollar statement as that would complicate Europe’s quantitative tightening plans. It was also interesting to hear Benoit Coeure, a hawkish member ECB executive board, saying this week that “it’s happening at different paces across the region, but we are moving to the point where we see wages going up”.

I think many of the Central Banks in developed countries are running out of wriggle room and the markets have yet to fully digest that reality. I fear that Goldilocks is about to get frazzled.

Remember deleveraging?

There is a lot of interesting stuff in the latest IMF Financial Stability Report. After much research on global debts levels (as per this post in 2014 and this one in 2015) over the past few years, the graph below on G20 gross debt levels from the IMF shows how little progress has been made.

click to enlarge

When looked at by advanced economy, the trend in gross debt from 2006 to 2016 looks startling, particularly for government debt.

click to enlarge

As the IMF state, “one lesson from the global financial crisis is that excessive debt that creates debt servicing problems can lead to financial strains” and “another lesson is that gross liabilities matter”.

The question does arise as to the economic impact of these debt levels if interest rates start to rise across advanced economies?

10 x Hopelessly Lax = ?

The economist Sir John Vickers, himself an ex Bank of England Chief Economist, recently had a pop at the current Bank of England’s governor and chair of the Financial Stability Board, Mark Carney.  He countered Carney’s assertion that “the largest banks are required to have as much as ten times more of the highest quality capital than before the crisis” with the quip that “ten times better than hopelessly lax is not a useful measure”. I particularly liked Vickers observation that equity capital is “a residual, the difference between two typically big numbers, of which the asset side is hard to measure given the nature of banking, and dependent on accounting rules”.

In a recent article in the FT, Martin Wolf joined in the Carney bashing by saying the ten times metric “is true only if one relies on the alchemy of risk-weighting” and that banking regulatory requirements have merely “gone from the insane to the merely ridiculous” since the crisis. Wolf acknowledges that “banks are in better shape, on many fronts, than they were a decade ago” but concludes that “their balance sheets are still not built to survive a big storm”.

I looked through a few of the bigger banks’ reports (randomly selected) across Europe and the US to see what their current risk weighted assets (RWA) as a percentage of total assets and their tier 1 common equity (CET1) ratios looked like, as below. The wide range of RWAs to total assets, indicative of the differing business focus for each bank, contrasts against the relatively similar level of core “equity” buffers.

click to enlarge

Wolf and Vickers both argue that higher capital levels, such as those cited by Anat Admati and Martin Hellwig in The Bankers’ New Clothes, or more radical structural reform, such as that proposed by Mervyn King (see this post), should remain a goal for current policymakers like Carney.

The latest IMF Stability Report, published yesterday, has an interesting exhibit showing an adjusted capital ratio (which includes reserves against expected losses) for the global systemically important banks (GSIBs), as below.

click to enlarge

This exhibit confirms an increased capital resilience for the big banks. Hardly the multiple increases in safety that Mr Carney’s statements imply however.

Productivity Therapy

The IMF has sponsored another paper from staffers on the global productivity slowdown, with the catchy title “Gone with the Headwinds”. The paper reiterates many of the arguments concerning advanced economies referenced in this post, such as total factor productivity (TFP) hysteresis due to the boom-bust financial cycle and resulting capital misallocation, “an adverse feedback loop of weak aggregate demand, investment, and capital-embodied technological change”, elevated economic and policy uncertainty.

click to enlarge

Also cited are structural headwinds including a waning information and communication technology (ICT) boom, an aging workforce, slower human capital accumulation, and slowing global trade integration (including the maturing of China’s integration into world trade). An exhibit on the ICT trends from the report is reproduced below.

click to enlarge

The report highlights short term remedies such as boosting private sector demand, efficient spending on infrastructure, strengthening balance sheets, and reducing economic policy uncertainty. Longer term remedies cited include policies to boost technological progress, policies to mitigate the effects of aging, policies to encourage migration, advancing an open global trade system, exploiting policy synergies, structural reforms, raising the quantity and quality of human capital.

Now, how many of these remedies are likely to be pursued in the current populist political environment? Although Trump has shown signs recently of doing the opposite to what he fought the election on, overall it does look like we are merrily going down a policy dead-end for the next few years in important advanced economies. Hopefully the policy dead-end will be principally confined to the US and they wouldn’t take too long in figuring out the silliness of the current journey and the need to get back to trying to deal with the big issues intelligently. Then again….