Category Archives: Equity Market

Patience on earnings

With the S&P500 up 100 points since last week’s low of 1882, the worry about global growth and earnings has been given a breather in the last few days trading. Last weeks low was about 12% below the May high (today’s close is at -8.6%). Last week, the vampire squid themselves lowered their S&P500 EPS forecast for 2015 and 2016 to $109 and $120 respectively, or approximately 18.2 and 16.6 times today’s close with the snappy by-line that “flats the new up”.

The forward PE, according this FACTSET report, as at last Thursday’s close (1924) was at 15.1, down from 16.8 in early May (as per this post).

click to enlargeForward 12 month PE S&P500 October2015

Year on year revenue growth for the S&P500 is still hard to find with Q3 expected to mark the third quarter in a row of declines, with energy and materials being a particular drag. Interestingly, telecom is a bright spot with at over 5% revenue growth and 10% earnings growth (both excluding AT&T).

Yardeni’s October report also shows the downward estimates of earnings and profit margins, as per below.

click to enlargeS&P500 EPS Profit Margin 2015 estimates

As usual, opinion is split on where the market goes next. SocGen contend that “US profits growth has never been this weak outside of a recession“. David Bianco of Deutsche Bank believes “earnings season is going to be very sobering“. While on the other side Citi strategist Tobias Levkovich opined that there is “a 96 percent probability the markets are up a year from now“.

Q3 earnings and company’s forecasts are critical to determining the future direction of the S&P500, alongside macro trends, the Fed and the politics behind the debt ceiling. Whilst we wait, this volatility presents an opportune time to look over your portfolio and run the ruler over some ideas.

Path of profits

The increase in corporate profits has been one of the factors behind the market run-up (as per posts such as here and here from last year). McKinsey have a new report out called “Playing to win: The new global competition for corporate profits” that predicts a decrease of the current rate of 10% of global GDP back to the 1980 level of below 8% by 2025.

Factors that McKinsey cite for the decline are that the impact of global labour arbitrage and falling interest rates have reached their limits. McKinsey also predict that competitive forces from 2 sources will drive down profits, as per the following extract:

“On one side is an enormous wave of companies based in emerging markets. The most prominent have been operating as industrial giants for decades, but over the past ten to 15 years, they have reached massive scale in their home markets. Now they are expanding globally, just as their predecessors from Japan and South Korea did before them. On the other side, high-tech firms are introducing new business models and striking into new sectors. And the tech (and tech-enabled) firms giants themselves are not the only threat. Powerful digital platforms such as Alibaba and Amazon serve as launching pads for thousands of small and medium-sized enterprises, giving them the reach and resources to challenge larger companies.”

Interesting graphs from the report included those below. One shows the factors contributing to the rise in US corporate profits, as below.

click to enlargeMGI Historical US Corporate Profit Components 1980 to 2013

Another graph shows the variability and median return on invested capital (ROIC) from US firms from 1964 to 2013, as below.

click to enlargeMGI Historical ROIC US Corporates 1964 to 2013

Another shows the reduction in labour inputs by country, as below.

click to enlargeMGI Labor Share of Total Income 1980 to 2012

Another shows the growth in corporate sales by region from 1980 to 2013, as below.

click to enlargeMGI Global Corporate Sales By Region

Another shows the ownership and the ROIC profile of the new competitors, as below.

click to enlargeMGI The New Competitors ownership split & ROIC by region

And finally the graph below shows McKinseys’ projections for EBITDA, EBIT, operating profit, and net income to 2025.

click to enlargeMGI Global Corporate Profits 1980 2013 2025

Sell in May and go away…

This week has been a volatile one on the markets with much of the week’s losses being regained after a “goldilocks” jobs number on Friday. Janet Yellen chipped in with the statement that “equity market values at this point generally are quite high” which resulted in the debates about market valuation been rehashed on the airwaves through the week.

My thoughts on the arguments were last aired in this post. I believe there is merit to the arguments that historical data needs to be normalized to take into account changes in business models within the S&P500 and the impact of changes in profit margins. Yield hungry investors and the lack of alternatives remain strong supports to the market, particularly given the current thinking on when US interest rate rises will begin. Adjustments on historical data such as those proposed by Philosophical Economics in this post make sense to me (although it’s noteworthy he concludes that the market is overvalued despite such adjustments).

Shiller’s latest PE10 metric (adjusted for inflation by the CPI) is currently over 27, about 38% above the average since 1960, as per the graph below.

click to enlargeCAPE PE10 1960 to May2015

I tend to put a lot of stock in the forward PE ratio due to the importance of projected EPS over the next 12 months in this market’s sentiment. Yardeni have some interesting statistics on forward PE metrics by sector in their recent report. Factset also have an interesting report and the graph below from it shows the S&P500 trading just below a 17 multiple.

click to enlargeForward 12 month PE S&P500 May2015

Recently I have become more cautious and the past week’s volatility has caused me to again review my portfolio with a ruthless eye on cutting those positions where my conviction against current valuation is weakest. Making investment decisions based upon what month it is can be justifiably called asinine and the graph below shows that the adage about going away in May hasn’t been a profitable move in recent years.

click to enlarge5 year S&P500 go away in May

However my bearishness is not based upon the calendar month; it’s about valuation and the nervousness I see in the market. To paraphrase a far wiser man than me, all I bring to the table is over 20 years of mistakes. Right now, I would far rather make the mistake of over-caution than passivity.

Converts on a comeback

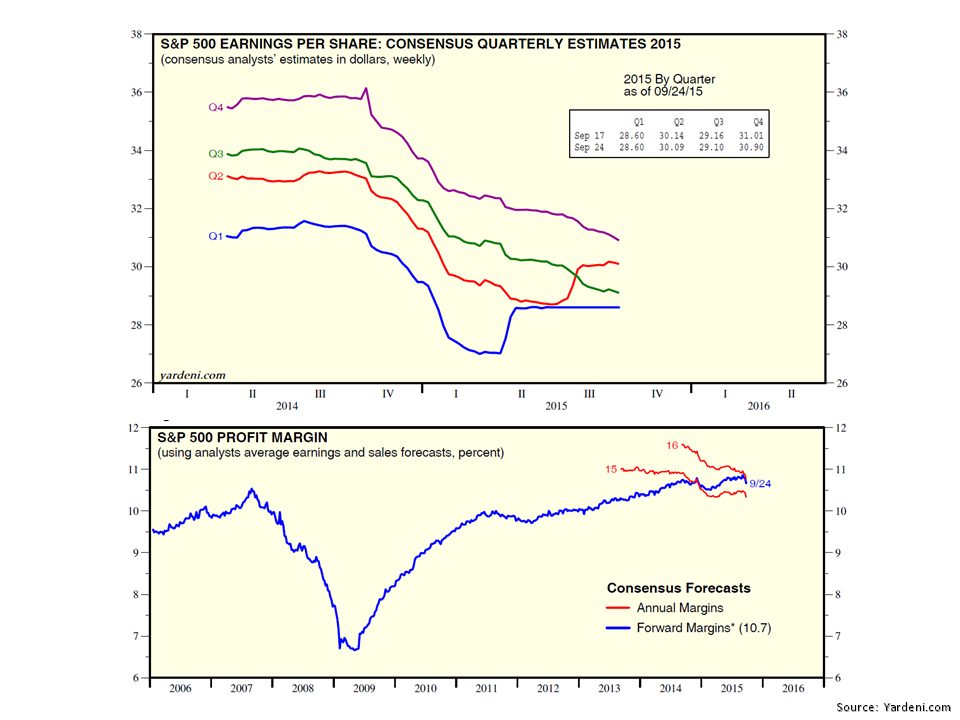
My initial reaction, from a shareholder view-point, when a firm issues a convertible bond is negative and I suspect that many other investors feel the same. My experience as a shareholder of firms that relied on such hybrid instruments has been varied in the past. Whether it’s a sign that a growing firm has limited options and may have put the shareholder at the mercy of some manipulative financier, or the prospect that arbitrage quants will randomly buy or sell the stock at the whim of some dynamic hedging model chasing the “greeks”, my initial reaction is one of discomfort at the uncertainty of how, by whom, and when my shareholding may be diluted.

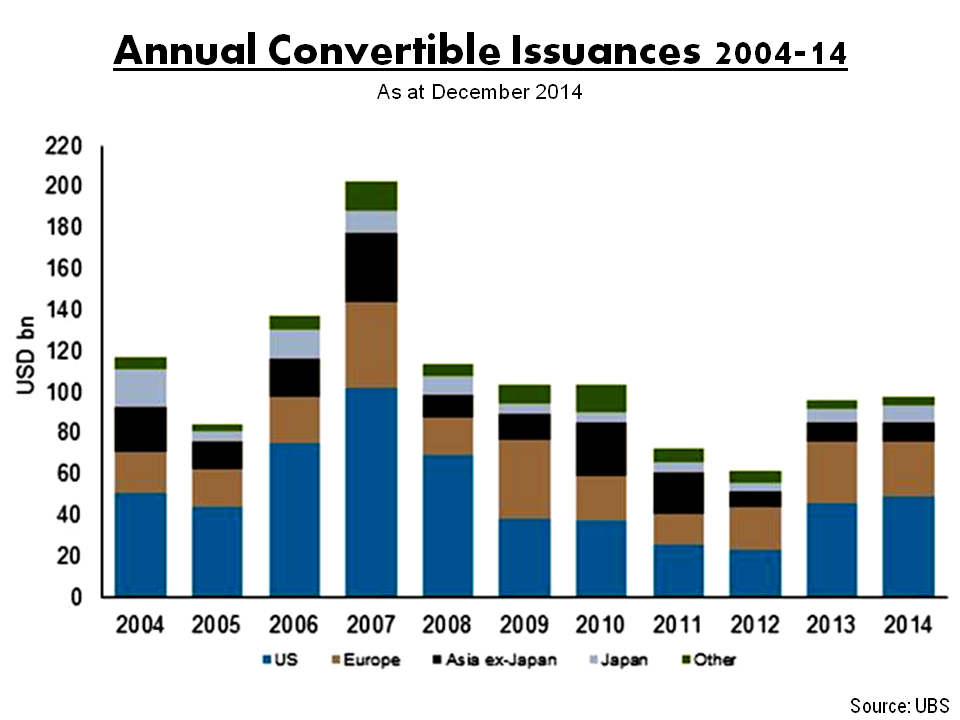
In today’s low risk premia environment, it’s interesting to see a pick-up in convertible issuances and, in the on-going search for yield environment, investors are again keen on foregoing some coupon for the upside which the embedded call option that convertibles may offer. Names like Tesla, AOL, RedHat, Priceline and Twitter have all been active in recent times with conversion premiums averaging over 30%. The following graph shows the pick-up in issuances according to UBS.

click to enlargeConvertible Bond Market Issuances 2004 to 2014

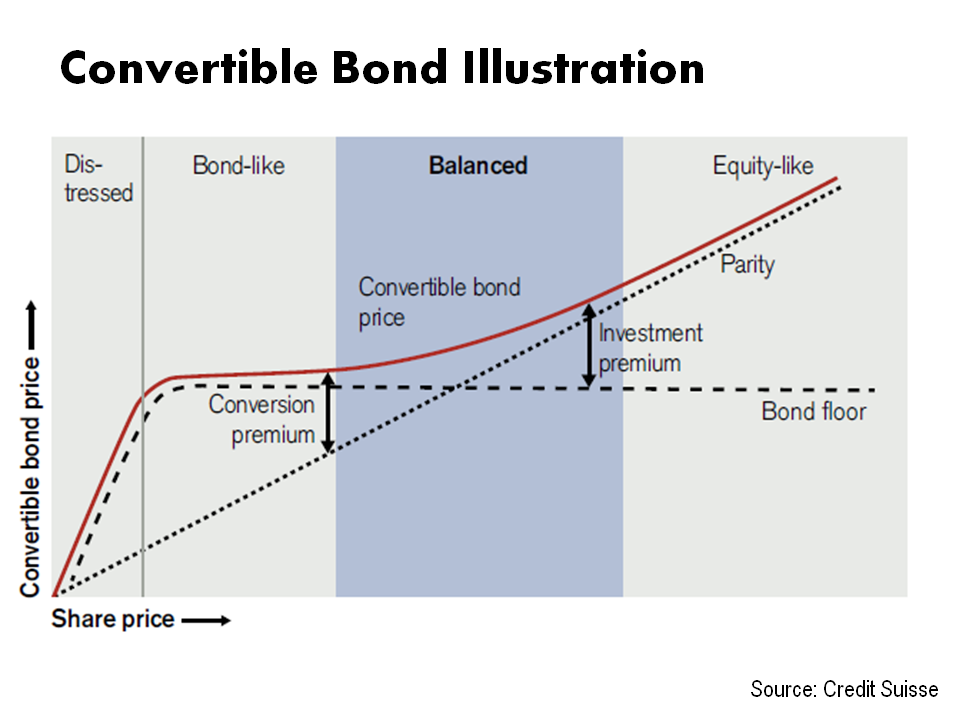
Convertible bonds have been around since the days of the railroad boom in the US and, in theory, combining the certainty of a regular corporate bond with an equity call option which offers the issuer a source of low debt cost at a acceptable dilution rate to shareholders whilst offering an investor the relative safety of a bond with a potential for equity upside. The following graphic illustrates the return characteristics.

click to enlargeConvertible Bond Illustration

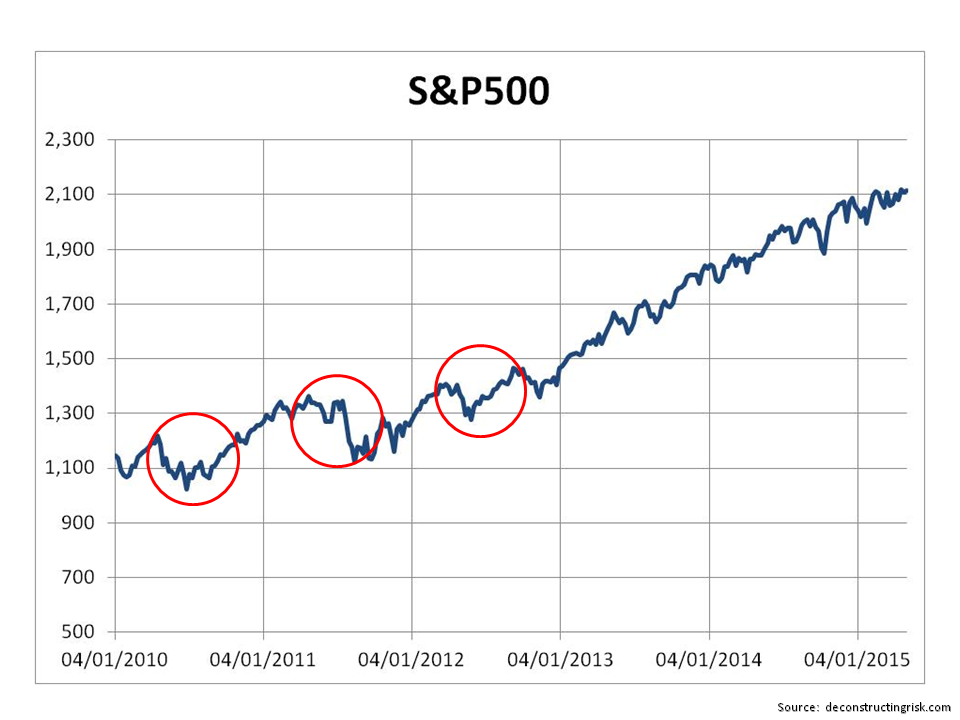
The problem for the asset class in the recent past came when the masters of the universe embraced convertible arbitrage strategies of long/short the debt/equity combined with heavy doses of leverage and no risk capital. The holy grail of an asymmetric trade without any risk was assumed to be at hand [and why not, given their preordained godness…or whatever…]! Despite the warning shot to the strategy that debt and equity pricing can diverge when Kirk Kerborian’s increased his stake in General Motors in 2005 just after the debt was downgraded, many convertible arb hedge funds continued to operate at leverage multiples of well in excess of 4.

The 2008 financial crisis and the unwinding of dubious lending practises to facilitate hedge fund leverage, such as the beautifully named rehypothecation lending by banks and brokers (unfortunately the actual explanation sounds more like a ponzi scheme), caused the arbitrage crash not only across convertibles but across many other asset classes mixed up in so called relative value strategies. This 2010 paper, entitled “Arbitrage Crashes and the Speed of Capital”, by Mark Mitchell and Todd Pulvino is widely cited and goes into the gory detail. There were other factors that exacerbated the impact of the 2008 financial crisis on the convertible debt market such as market segmentation whereby investors in other asset classes were slow to move into the convertible debt market to correct mis-pricing following the forced withdrawal of the hedge funds (more detail on this impact in this paper from 2013).

Prior to the crisis, convertible arb hedge funds dominated the convertible bond market responsible for up-to 80% of activity. Today, the market is dominated by long only investors with hedge funds only reported to be responsible for 25% of activity with those hedge funds operating at much lower leverage levels (prime brokers are restricted to leverage of less than 1.5 times these days with recent talk of an outright rehypothecation ban for certain intermediaries on the cards). One of the funds that made it through the crash, Ferox Capital, stated in an article that convertible bonds have “become the play thing of long only investors” and that the “lack of technically-driven capital (hedge funds and proprietary trading desks) should leave plenty of alpha to be collected in a relatively low-risk manner” (well they would say that wouldn’t they!).

The reason for my interest in this topic is that one of the firms I follow just announced a convertible issue and I wanted to find out if my initial negative reaction is still justified. [I will be posting an update on my thoughts concerning the firm in question, Trinity Biotech, after their Q1 results due this week].

Indeed, the potential rehabilitation of convertible bonds to today’s investors is highlighted by the marketing push from people like EY and Credit Suisse on the benefits of convertible bonds as an asset class to insurers (as per their recent reports here and here). EY highlight the benefit of equity participation with downside protection, the ability to de-risk portfolios, and the use of convertible bonds to hedge equity risk. Credit Suisse, bless their little hearts, go into more technical detail about how convertibles can be used to lower the solvency requirement under Solvency II and/or for the Swiss Solvency Test.

With outstanding issuances estimated at $500 billion, the market has survived its turbulent past and it looks like there is life left in the old convertible bond magic dog yet.

STOXX600 versus S&P500

There is a nice article over at the Philosophical Economics blog from last month on the dangers of using the Shiller CAPE when the constituents of the underlying indices are constantly evolving. I particularly like the Ship of Theseus thesis being updated by the case of the 1970s group the Little River Band! As always with the Philosophical Economics blog, the post is well worth a read and provides some interesting food for thought in the on-going CAPE debate. I also largely agree with the author’s analysis on Europe and the assertion that monetary union “is going to have to eventually dissolve, or at least undergo a substantial makeover”.

In the post, the author references an April 2013 report from KPMG’s Global Valuation Institute on why more European firms traded below their book value following the financial crisis than US firms. One exhibit, produced below, shows that European firms in the STOXX600 recorded less impairments than S&P500 firms through the crisis. This highlights the sources of the impairments and the differing accounting standards at play.

click to enlargeSTOXX600 vrs S&P500 Impairments

Another exhibit from the report illustrates the different sectors that make up the STOXX600 and S&P500 and the percentage of each sector that traded below book value in early 2013. It would be really interesting to see an update of this exhibit.

click to enlargeSTOXX600 vrs S&P500