Tag Archives: Goldman Sachs

Farewell, dissonant 2016.

Many things will be written about the events of 2016.

The populist victories in the US election and the UK Brexit vote will no doubt have some of the biggest impacts amongst the developed world. Dissatisfaction amongst the middle class across the developed world at their declining fortunes and prospects, aligned with the usual disparate minorities of malcontent, has forced a radical shift in support away from the perceived wisdom of the elite on issues such as globalisation. The strength of the political and institutional systems in the US and the UK will surely adapt to the 2016 rebuff over time.

The more fundamental worry for 2017 is that the European institutions are not strong enough to withstand any populist curveball, particularly the Euro. With 2017 European elections due in France, Germany, Netherlands and maybe in Italy, the possibility of further populist upset remains, albeit unlikely (isn’t that what we said about Trump or Brexit 12 months ago!).

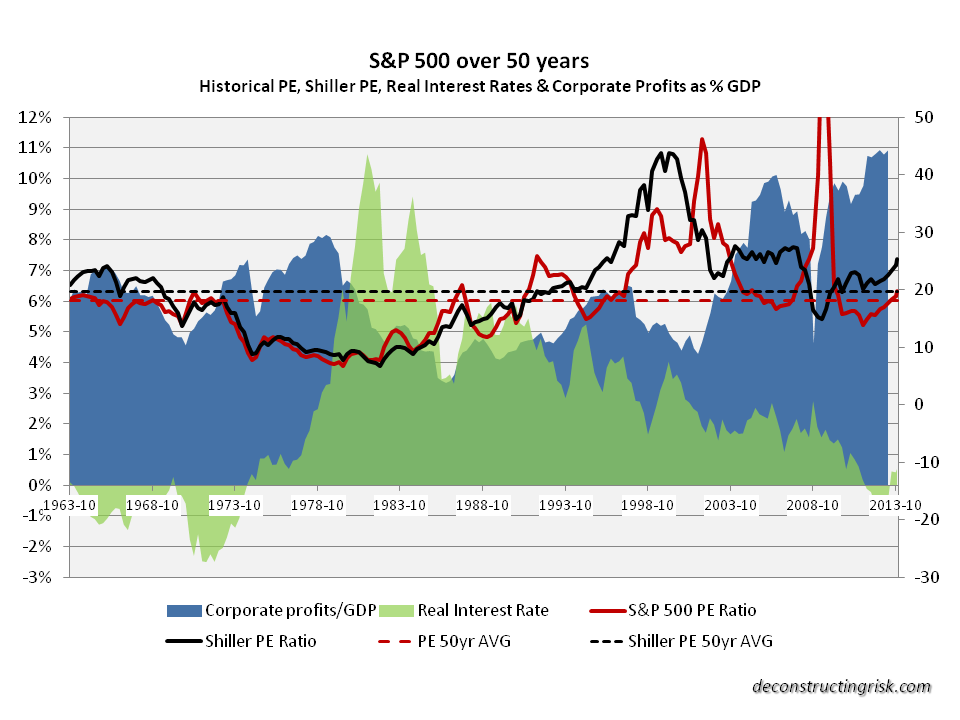
The 5% rise in the S&P 500 since Trump’s election, accounting for approx half of the overall increase in 2016, has made the market even more expensive with the S&P 500 currently over 60% of its historical average based upon the 12 month trailing PE and the Shiller CAPE (cyclically adjusted price to earnings ratio, also referred to as the PE10). A recent paper by Valentin Dimitrov and Prem C. Jain argues that stocks outperform 10-year U.S. Treasuries regardless of CAPE except when CAPE is very high (the current CAPE is just above the “very high” reference point of 27.6 in the paper) and that a high CAPE is an indicator of future stock market volatility. Bears argue that the President elect’s tax and expansionary fiscal policies will likely lead to higher interest rates and inflation in 2017 which will further strengthen the dollar, both of which will pressure corporate earnings.

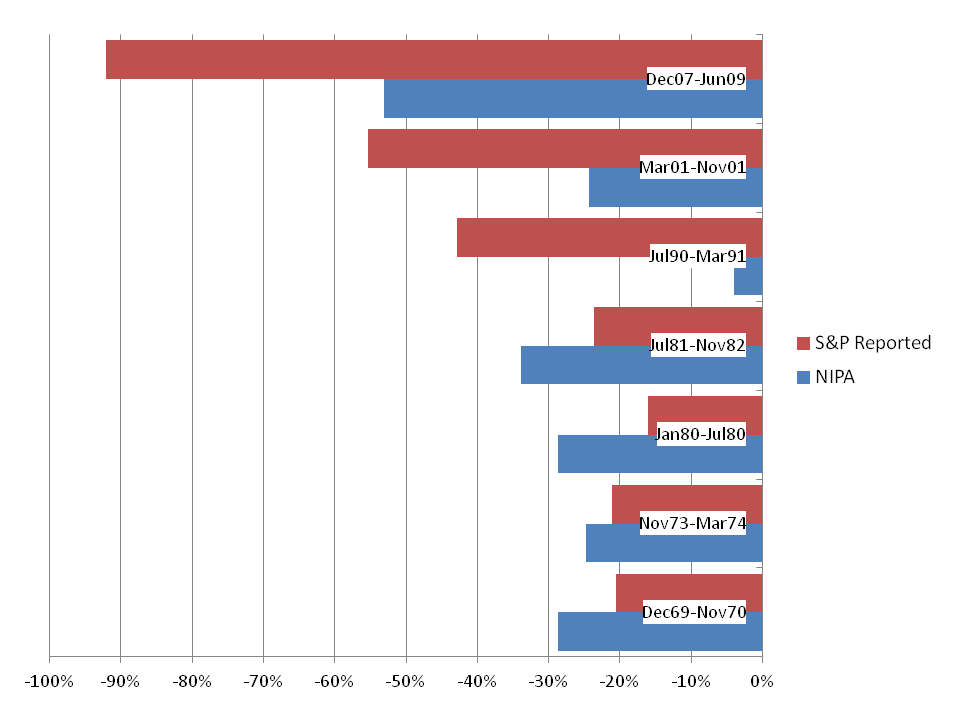
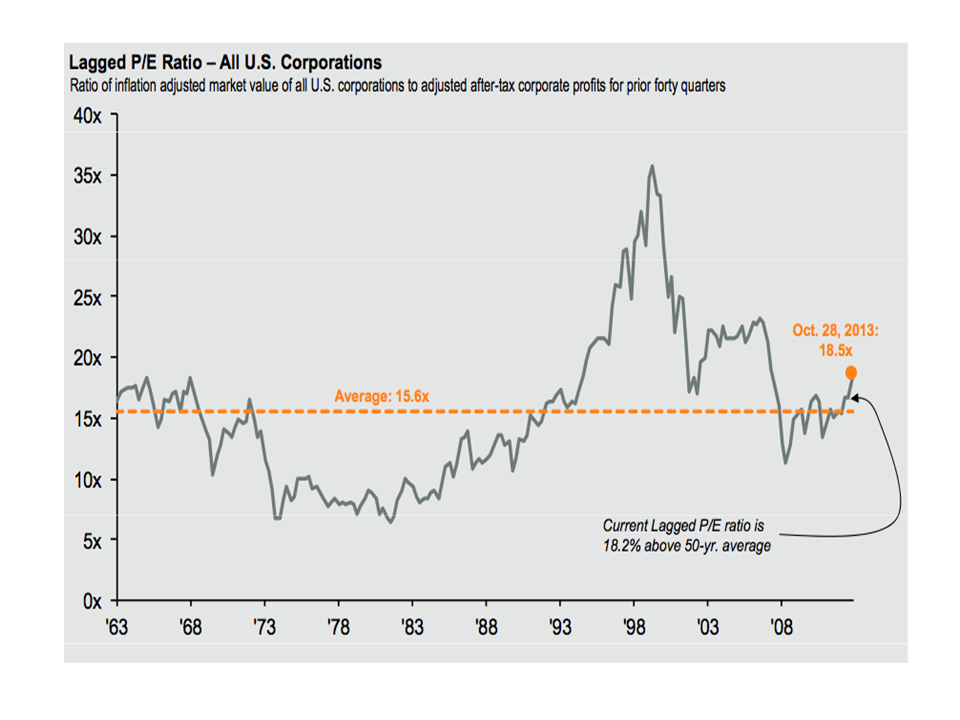
Critics of historical PE measures like CAPE, such as Jeremy Siegel in this paper (previous posts on this topic are here and here), highlight the failings of using GAAP earnings and point to alternative metrics such as NIPA (national income and product account) after-tax corporate profits which indicate current valuations are more reasonable, albeit still elevated above the long term average by 20%-30%. The graph below from a Yardeni report illustrates the difference in the earnings metrics.

click to enlargenipa-vrs-sp500-earnings

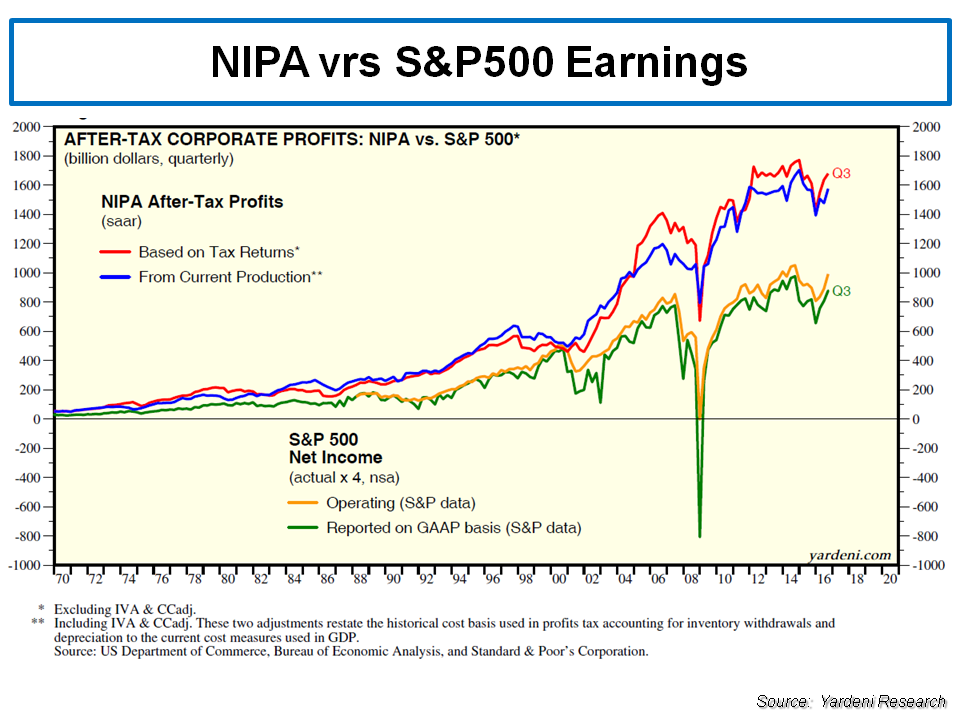
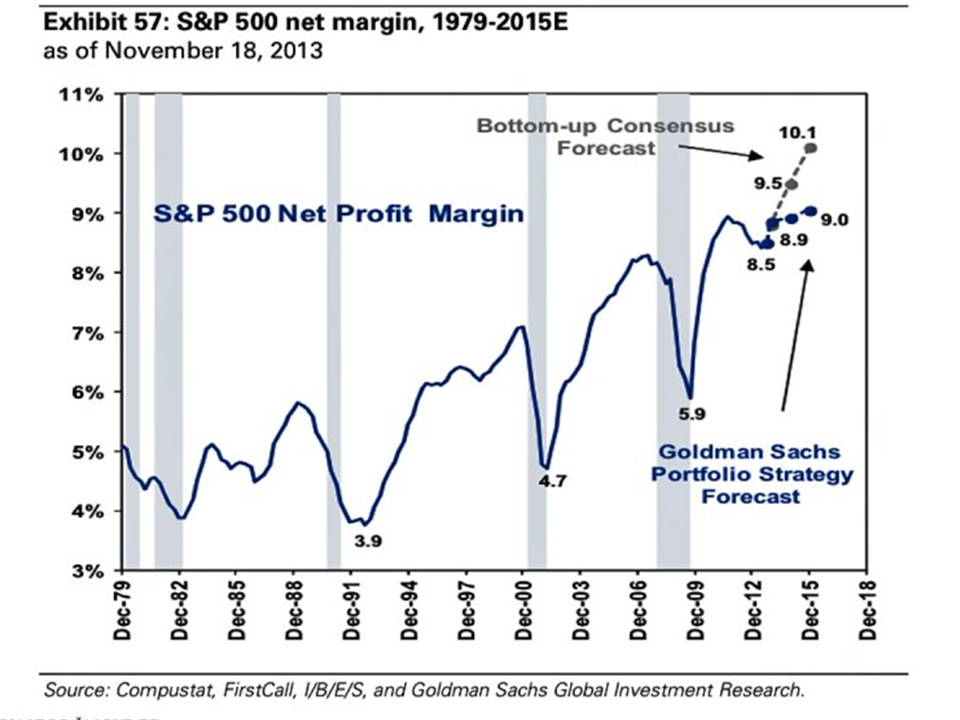
Bulls further point to strong earnings growth in 2017 complemented by economic stimulus and corporate tax giveaways under President Trump. Goldman Sachs expects corporations to repatriate approx $200 billion of overseas cash and to spend a lot of it buying back stock rather than making capital expenditures (see graph below) although the political pressure to invest in the US may impact the balance.

click to enlargesp500-use-of-cash-2000-to-2017

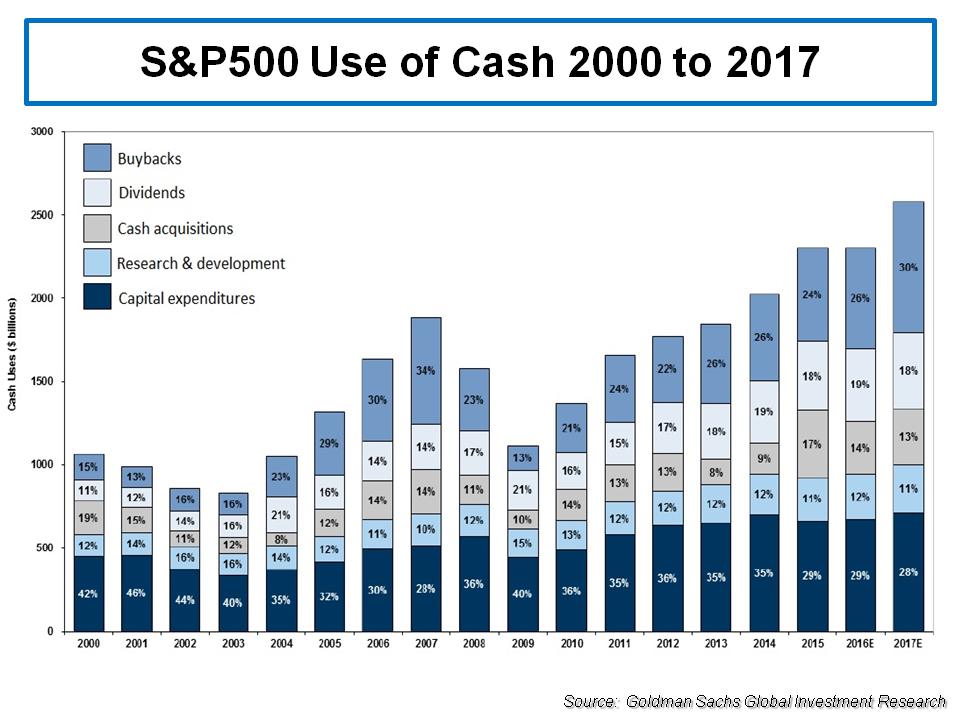
The consensus amongst analysts predict EPS growth in 2017 in the high single digits, with many highlighting further upside depending upon the extent of the corporate tax cuts that Trump can get past the Republican congress. Bulls argue that the resulting forward PE ratio for the S&P 500 of approx 17 only represents a 20% premium to the longer term average. Predictions for the S&P 500 for 2017 by a selection of analysts can be seen below (the prize for best 2016 prediction goes to Deutsche Bank and UBS). It is interesting that the average prediction is for a 4% rise in the S&P500 by YE 2017, hardly a stellar year given their EPS growth projections!

click to enlargesp500-predictions-2017

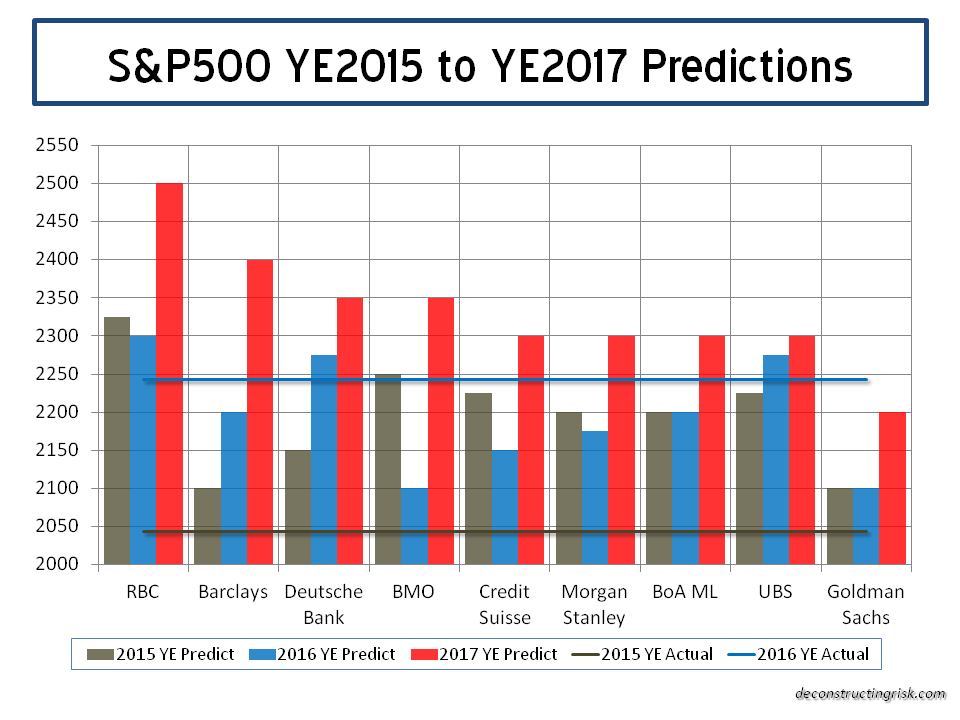
My best guess is that the market optimism resulting from Trump’s victory continues into 2017 until such time as the realities of governing and the limitations of Trump’s brusque approach becomes apparent. Volatility is likely to be ever present and actual earnings growth will be key to the market story in 2017 and maintaining high valuation multiples. After all, a low or high PE ratio doesn’t mean much if the earnings outlook weakens; they simply indicate how far the market could fall!

Absent any significant event in the early days of Trump’s presidency (eh, hello, Mr Trump’s skeleton cupboard), the investing adage about going away in May sounds like a potentially pertinent one today. Initial indications of Trump’s reign, based upon his cabinet selections, indicate sensible enough domestic economy policies (relatively) compared with an erratic foreign policy agenda. I suspect Trump first big foreign climb down will come at the hands of the Chinese, although his bromance with Putin also looks doomed to failure.

How Brexit develops in 2017 looks to be much more worrying prospect. After watching her actions carefully, I am fast coming to the conclusion that Theresa May is clueless about how to minimise the financial damage from Brexit. Article 50 will be triggered in early 2017 and a hard Brexit now seems inevitable, absent a political shock in Europe which results in an existential threat to the EU and/or the Euro.

The economic realities of Brexit will only become apparent to the UK and its people, in my view, after Article 50 is triggered and chunks of industry begin the slow process of moving substantial parts of their operation to the continent. This post illustrates the point in relation to London’s insurance market. The sugar high provided by the sterling devaluation after Brexit is fading and the real challenge of extracting the UK from the institutions of the EU are becoming ever apparent.

Prime Minister May should be leading her people by arguing for the need for a sensible transition period to ensure a Brexit logistical tangle resulting in unnecessary economic damage is avoided. Instead, she acts like a rabbit stuck in the headlights. Political turmoil seems inevitable as the year develops given the current state of the UK’s fractured political system and lack of sensible leadership. The failure of a coherent pro-Europe political alternative to emerge in the UK following the Brexit vote, as speculated upon in this post, is increasingly looking like a tragedy for the UK.

Of course, Trump and Brexit are not the only issues facing the world in 2017. China, the Middle East, Russia, climate change, terrorism and cyber risks are just but a few of the issues that seem ever present in any end of year review and all will likely be listed as such in 12 months time. For me, further instability in Europe in 2017 is the most frightening potential addition to the list.

As one ages, it becoming increasingly understandable why people think their generation has the best icons. That said, the loss of genuine icons like Muhammad Ali and David Bowie (eh, sorry George Michael fans) does put the reality of the ageing (as highlighted in posts here and here) of the baby boomer generation in focus. On a personal note, 2016 will always be remembered by me for the loss of an icon in my life and emphasizes the need to appreciate the present including all of those we love.

So on that note, I’d like to wish all of my readers a prosperous, happy and healthy 2017. It looks like there will be plenty to write about in 2017…..

One Direction

Goldman Sachs says “we have more potential for shocks right now”. Deutsche Bank and Bank of America Merrill Lynch predict a pick-up in volatility to hit equities. The ever positive Albert Edwards of Socgen points to a recent IMF report on debt and trashes the Fed with the quip “these dudes will never identify an asset bubble at least before the event!

In the IMF report referenced above, and other reports published by the IMF this month, there is some interesting analysis and a sample of the accompanying graphs are reproduced below.

All of these graphs show trends going inexorably in one direction. Add in dollops of (not unrelated) political risk particularly in the UK and across Europe, and that direction looks like trouble ahead.

click to enlargeimf-gross-global-debt-as-of-gdp

click to enlargeimf-private-debt-during-deleveraging-periods

click to enlargeimf-decomposition-of-equity-valuations-october-2016

click to enlargeimf-global-real-rates

click to enlargeimf-report-sovereign-bond-yields-and-term-premiums

click to enlargeimf-report-banking-sector

click to enlargeimf-report-pension-deficits

The Float Game Goes Into Overdrive

The IMF today warned about rising global financial stability risks. Amongst the risks, the IMF highlighted the “continued financial risk taking and search for yield keep stretching some asset valuations” and that “the low interest rate environment also poses challenges for long term investors, particularly for weaker life insurance companies in Europe”. The report states that “the roles and adequacy of existing risk-management tools should be re-examined to take into account the asset management industry’s role in systemic risk and the diversity of its products”.

In late March, Swiss Re issued a report which screamed that the “current high levels of financial repression create significant costs and lower long-term investors’ ability to channel funds into the real economy”. The financial repression, as Swiss Re calls it, has resulted in an estimated loss of $470 billion of interest income to US savers since the financial crisis which impacts both households and long-term investors such as insurance companies and pension funds.

Many market pundits, Stanley Druckenmiller for example, have warned of the destabilizing impacts of long term low interest rates. I have posted before on the trend of hedge funds using specialist insurance portfolios as a means to take on more risk on the asset side of the balance sheet in an attempt to copy the Warren Buffet insurance “float” investment model. My previous post highlighted Richard Brindle’s entry into this business model with a claim that they can dynamically adjust risk from one side of the balance sheet to the other. Besides the influx of hedge fund reinsurers, there are the established models of Fairfax and Markel who have successfully followed the “Buffet alpha” model in the past. A newer entry into this fold is the Chinese firm Fosun with their “insurance + investment twin-driver core strategy”.

The surprise entry by the Agnelli family’s investment firm EXOR into the Partner/AXIS marriage yesterday may be driven by a desire to use the reinsurer as a source of float for its investments according to this Artemis article on the analyst KBW’s reaction to the new offer. In the presentation on the offer from EXOR’s website, the firm cites as a rationale for a deal the “opportunity to exploit know-how synergies between EXOR investment activities” and the reinsurer’s investment portfolio.

Perhaps one of the most interesting articles on the current market in recent weeks is this one from the New York Times. The article cites the case of how the private equity firm Apollo Global Management purchased Aviva’s US life insurance portfolio, ran it through some legit regulatory and tax arbitrage structures with Goldman Sachs help, and ended up using some of the assets behind the insurance liabilities to prop up the struggling casino company behind Caesars and Harrah’s casinos. Now that’s a story that speaks volumes to me about where we are in the risk appetite spectrum today.

Then again, always look on the bright side……

To recap on the bear case for the US equity market, factors highlighted are high valuation as measured by the cyclically adjusted PE ratio (CAPE) and the high level of corporate earnings that look unsustainable in a historical context. I have tried to capture these arguments in the graph below.

click to enlarge50 year S&P500 PE CAPE real interest rate corp profit&GDPCurrently, the S&P500 PE and the Shiller PE/CAPE are approx 10% and 30% above the average over the past 50 years respectively.

On earnings, Andrew Lapthorne of SocGen, in an August report entitled “To ignore CAPE is to deny mean reversion” concluded that “mean-reversion in earnings, though sometimes delayed, is as undeniable as the economic cycle itself. That peak profits typically accompany peak valuations only reinforces the point. When earnings revert back to mean (and below), the valuation will also collapse.” The graphic below from that report highlights the point.

click to enlargeSocGen Mean Reverting ProfitsThe ever bullish Jeremy Siegel, in a recent conference presentation, again outlined his arguments raised in the August FT article (see Shiller versus Siegel on CAPE post). The fifth edition of his popular book “Stocks for the long run” is out in December. Essentially he argues that CAPE is too pessimistic as accounting changes since 1990 distort historical earnings and the profile of S&P500 earnings has changed with bigger contributions from foreign earnings and less leveraged balance sheets that explain the higher corporate margins.

Siegel contends that after-tax profits published in the National Income and Product Accounts (NIPA) are not distorted by the large write downs from the likes of AOL and AIG. The changing profile of NIPA versus S&P reported earnings through historical downturns illustrate that historical S&P reported earnings are unreliable, as illustrated in the graph below.

click to enlargeNIPA versus S&P reported

However, even using NIPA data, a graphic from JP Morgan in late October shows that currently the S&P500 is approx 20% above its 50 year average.

click to enlargeS&P500 CAPE with NIPASiegel even proposed that current comparison should be against the long term average PE (1954 to 2013) of 19 including only years where interest rates were below 8% (which incidentally is only slightly higher than the 8.2 5o year average used in the first graph of this post).

The ever insightful Cliff Asness, founder of AQR Capital Management, counteracts such analysis with the recent comment below.

Does it seem to anyone else but me that the critics have a reason to exclude everything that might make one say stocks are expensive, and instead pick time periods for comparisons and methods of measurement that will always (adapting on the fly) say stocks are fair or cheap?

However, nothing is as black and white in the real world. The rise in corporate net margins has been real as another recent graphic, this time from Goldman Sachs, shows.

click to enlargeGoldman Sachs S&P500 net margin

Earnings from foreign subsidiaries have increased and S&P500 earnings as a percentage of global GDP show a more stable picture. Also leverage is low compared to historical levels (104% debt to equity for S&P500 compared to a 20 year average of 170%) and cash as a percentage of current assets is also high relative to history (approx 28%). Although there is signs that corporate leverage rates are on the rise again, future interest rate rises should not have as big an impact on corporate margins as they have historically.

JP Morgan, in another October bulletin, showed the breakdown of EPS growth in the S&P500 since 2010, as reproduced below, which clearly indicates a revenue and margin slowdown.

click to enlargeJP Morgan S&P500 EPS Annual Growth Breakdown October 2013David Bianco of Deutsche Bank has recently come up with a fascinating graphic that I have been looking at agog over the past few days (reproduced below). It shows the breakdown of S&P500 returns between earnings growth, dividends and PE multiple expansion.

click to enlargeDeutsche Bank S&P500 Growth BreakdownBianco, who has a  2014 end target of 1850 and a 2015 end target of 2000 for the S&P500, concluded that 75% of the S&P500 rise in 2013 is from PE expansion and that “this is the largest [valuation multiple] contribution to market return since 1998. Before assuming further [multiple] expansion we think it is important that investors be confident in healthy EPS growth next year. Hence, we encourage frequent re-examination of the capex and loan outlook upon new data points.

David Kostin from Goldman Sachs, who have a 2,100 S&P end 2015 target, stated that “multiple expansion was the key U.S. equity market story of 2013. In contrast the 2014 equity return will depend on earnings and money flow rather than further valuation re-rating.

Even well known pessimists like David Rosenberg and Nouriel Roubini are positive albeit cautious. Dr Doom has a 2014 target for S&P500 of 1900 (range 1650 to 1950) although he does give the US equity market an overall neutral rating. Rosenberg, who describes the current rally as “the mother of all liquidity rallies“, cites the US economy’s robustness over the past year as a sign that 2014 should see a further strengthening of the US economy.

So clearly future growth in the S&P500 will depend upon earnings and that will depend upon the economy and interest rates. Although I am still trying to get my head around a fascinating article from 2005 that shows negative correlation between equity returns and GDP growth, that brings me back to the macro-economic situation.

I know this post was to have represented the positive side of the current arguments but, as my current bear instincts can’t be easily dispelled, I have to conclude the post with the comments from Larry Summers at a IMF conference earlier this month that the US may be stuck in a “secular stagnation” and that the lesson from the crisis is “it’s not over until it is over, and that is surely not right now”.

Factors impacting AIG’s valuation

AIG stock has been the subject of much investor attention in recent times and has doubled over the past 24 months. The new AIG has become a hedge fund favourite, the 3rd most popular stock according to Goldman Sachs. I did briefly look over AIG at the end of 2010 when it traded around $35 but concluded there was too much uncertainty around its restructuring and I particularly didn’t like the P&C reserve deteriorations in 2009 and 2010. The stock fell below $25 in 2011 before reversing and beginning its recent accent above $45 as further clarity on its business performance emerged. I figured now is a good time to give the new AIG another look.

Unless you have been living on Mars, everybody is aware that AIG has had a very colourful history and, although it’s past is not the focus of this post, the graph below of the 10 year history of the stock is a reminder of the grim fate suffered by its equity holders with the current price still only about 5% of the pre-crash average. For what it is worth, the 2005 Fortune article “All I want in life is an unfair advantage” and the 2009 Vanity Fair article “The Man Who Crashed the World” by Michael Lewis are two of my favourites on the subject and worth a read.

click to enlargeAIG 10 year stock price

To understand the new AIG we need to review the current balance sheet and the breakdown of the sources of net income since 2010. The balance sheet (excluding segregated assets & liabilities) as at Q2 2013 is represented in the exhibit below.

click to enlargeAIG Balance Sheet & Assets

AIG’s liquid assets look reasonably diverse and creditworthy although these assets should really be looked at in their respective business units. The P&C assets are the more conservative and look in line with their peers. The life and retirement assets are riskier and reflect the underling product mix and risk profile of that business.

Another item to note is the $31.2 billion of aircraft leasing assets from ILFC against the $26.5 billion of liabilities representing $4.7 billion of net assets. AIG’s deal to sell 80% of ILFC to a Chinese consortium for book value looks like it may fall apart. If it does, the possibility of going down the IPO route is now a realistic option, absent a change in current market conditions.

The next item to note is the other assets representing 13% of total assets. These are primarily made up of $20 billion of deferred taxes, $9 billion of DAC, $14 billion of premium receivables, and $15 billion of various assets. This last item includes $2.8 billion of fair value derivative assets which correspond to $3.1 billion of fair value derivative liabilities. The notional value of these assets and liabilities is approximately $90 billion and $110 billion respectively from primarily interest rate contracts but also FX, equity, commodity and credit derivatives that are not designated for hedging purposes. The majority (about 2/3rd) of these are from the Global Capital Markets division which includes the run-off of the infamous AIG Financial Products (AIGFP) unit.

AIG’s non-life reserves, at $108 billion, have been a source of volatility in the past with significant strengthening required in 2002, 2004, 2005, 2009 and 2010. The life and retirement reserves are split $121 billion of policyholder contracts (including guaranteed variable annuity products like GMWB), $5 billion of other policyholder funds, and $40 billion of mortality and morbidity reserves.

A breakdown of AIG’s net income since 2010 shows the sources of profit and losses as per the graph below.

click to enlargeAIG Net Income Breakdown 2010 to Q22013

The graph shows that the impact of discontinued operations has been playing less of a part in the net income line. It also points to the need to understand the importance of the other business category in 2011 and 2012 as well as the relative underperformance in the P&C division in contributing to net income for 2010 to 2012.

In 2011, contributors to other pre-tax income included a $1.7 billion impairment charge on ILFC’s fleet and a net $2.9 billion charge due to the termination of the New York Fed credit facility. 2012 net income included a $0.8 billion gain on the sale of AIA shares and an increase of $2.9 billion in the fair value of AIG’s interest in Maiden Lane III (the vehicle created during the AIG bailout for AIGFP’s CDO credit default swap portfolio). These 2012 gains were partially offset by an increase of $0.8 billion in litigation reserves.

AIG bulls point to the 2013 YTD performance. Improved operating margins in the core P&C and life/retirement units have combined with income from the other activities (mortgage business, Global Capital Markets & Direct Investment portfolios) covering corporate and interest expenses and any other one off charges (such as those in the paragraph above). This performance has led analysts to predict 2013 EPS around $4.20 and 2014 EPS of $4.30 to $4.50.

AIG has traded at a significant discount to its peers on a book value basis as a result of its troubled past and currently trades at 0.73. The graphs below uses recently published book values and book value excluding Accumulated Other Comprehensive Income (AOCI) which have been the subject to adjustment and reinstatement and may not therefore reflect the book values published at the time.

click to enlargeAIG stock price to book values 2009 to August 2013

AIG Book Value Multiples 2009 to August 2013

In summary, the factors impacting the current AIG valuation are the significant book value discount as a result of AIG’s history, the uncertainty around the ILFC sale, the future prospects of the core P&C and life/retirement units, and the historical volatility in the other operating business lines (and the potential for future volatility!). Each of these items need to be understood further before any conclusions can be reached on whether AIG is currently undervalued or overvalued. In a follow-on post on AIG I will try to dig deeper into each of these factors and also offer my thoughts on future performance and valuation of the new AIG.