Tag Archives: reinsurance rates

Hot Take-outs

In many episodes of fervent investment activity within a particular hot spot, like the current insurance M&A party, there is a point where you think “really?”. The deal by Mitsui Sumitomo to take over Amlin at 2.4 times tangible book is one such moment. A takeover of Amlin was predicted by analysts, as per this post, so that’s no surprise but the price is.

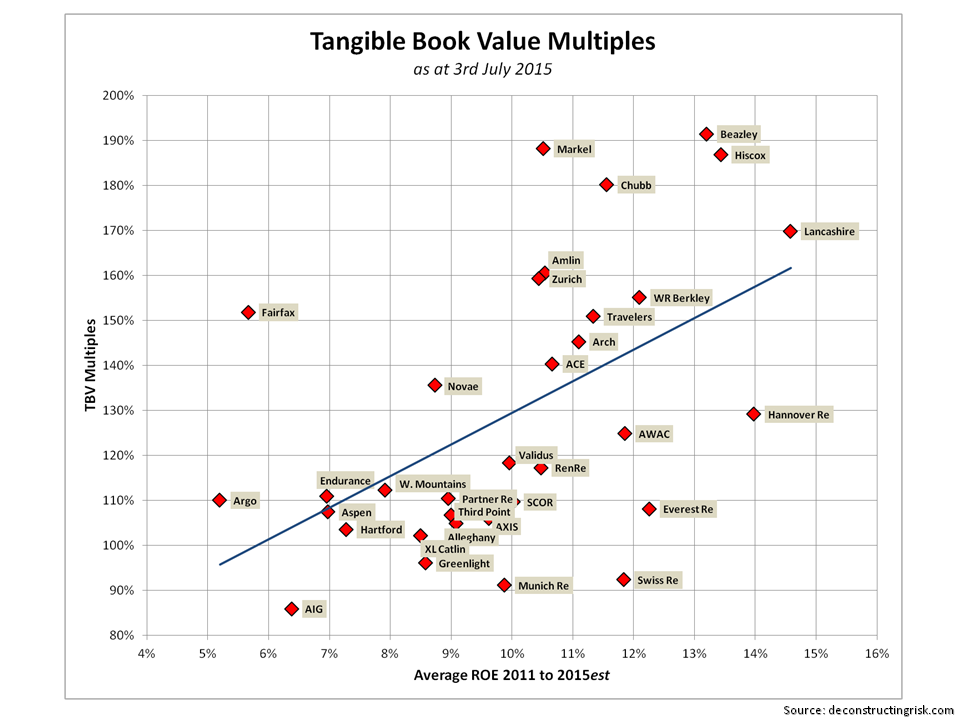
With the usual caveat on the need to be careful when comparing multiples for US, Bermuda, London and European insurers given the different accounting standards, the graph below from a December post, shows the historical tangible book value levels and the improving multiples being applied by the market to London firms such as Amlin.

click to enlargeHistorical Tangible Book Multiples for Reinsurers & Specialty Insurers

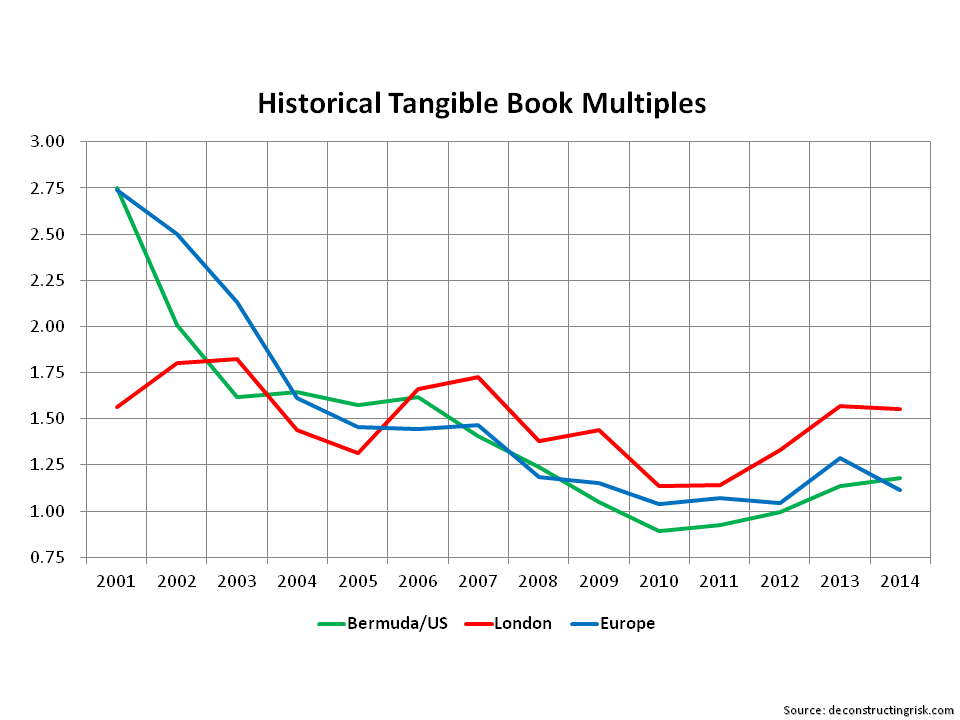
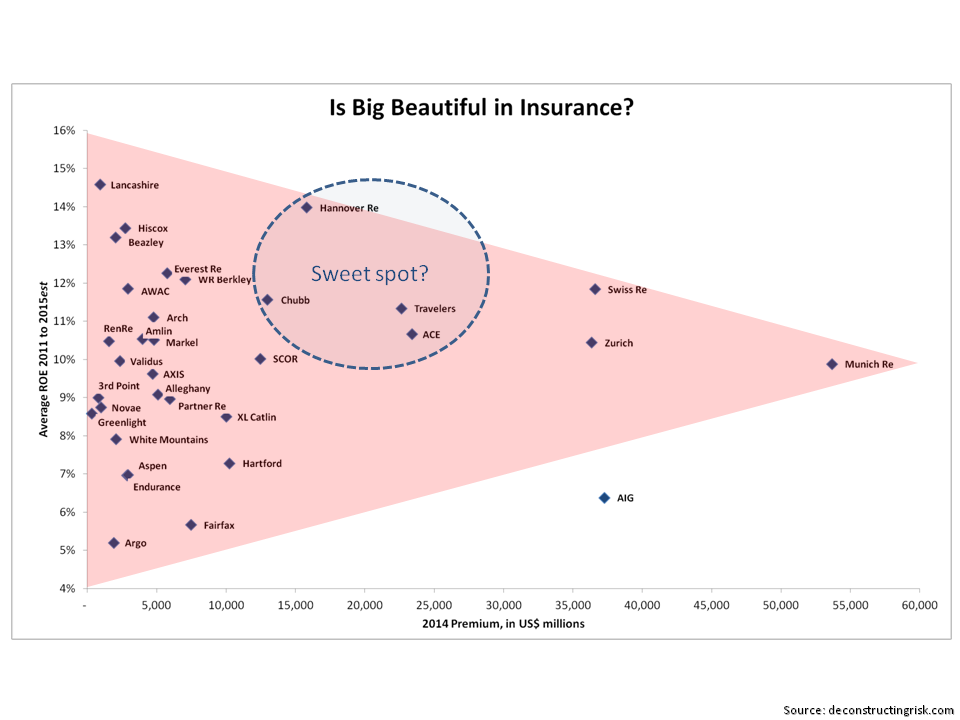
Comparable multiples from recent deals, as per the graph below, show the high multiple of the Mitsui/Amlin deal. Amlin has a 10 year average ROE around 20% but a more realistic measure is the recent 5 year average of 11%. In today’s market, the short to medium term ROE expectation is likely to be in the high single digits. Even at 10%, the 2.4 multiple looks aggressive.

click to enlargeM&A Tangible Book Multiples September 2015

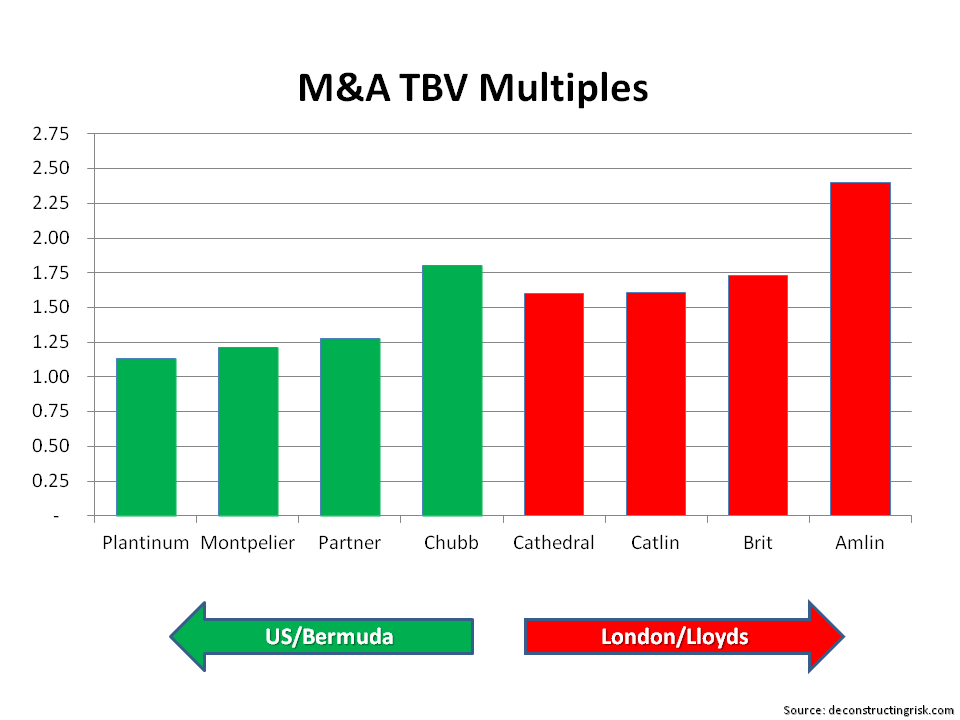
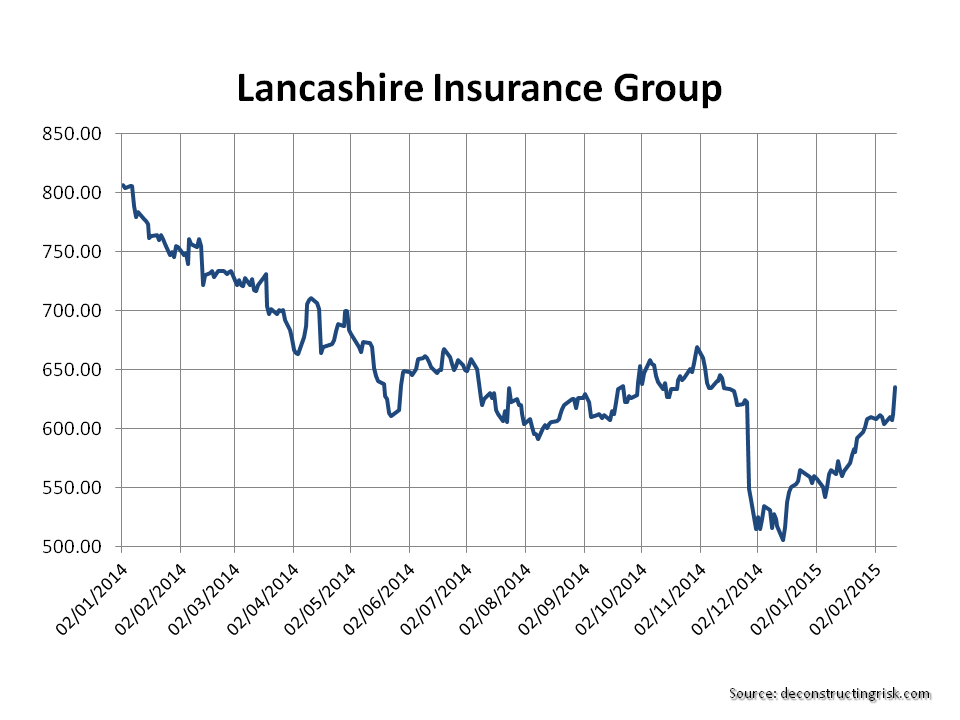
There is little doubt that the insurance M&A party will continue and that the multiples may be racy. In the London market, the remaining independent players are getting valued as such, as per the graph below tracking valuations at points in time.

click to enlargeLondon Specialty Insurers Tangible Book Values

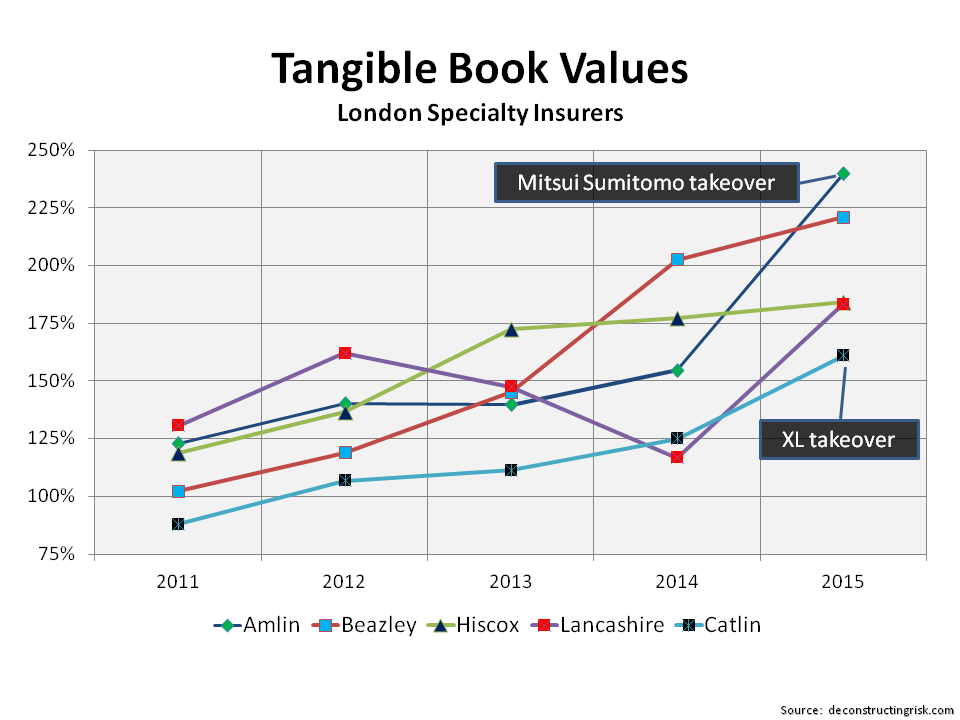
When the hangover comes, a 2.4 multiple will look even sillier than its does now at this point in the pricing cycle. In the meantime, its party like 1999 time!

Insurers keep on swinging

In a previous post, I compared the M&A action in the reinsurance and specialty insurance space to a rush for the bowl of keys in a swingers party. Well, the ACE/Chubb deal has brought the party to a new level where anything seems possible. The only rule now seems to be a size restriction to avoid a G-SIFI label (although MetLife and certain US stakeholders are fighting to water down those proposals for insurers).

I expanded the number of insurers in my pool for an update of the tangible book multiples (see previous post from December) as per the graphic below. As always, these figures come with a health warning in that care needs to be taken when comparing US, European and UK firms due to the differing accounting treatment (for example I have kept the present value of future profits as a tangible item). I estimated the 2015 ROE based upon Q1 results and my view of the current market for the 2011 to 2015 average.

click to enlargeReinsurers & Specialty Insurers NTA Multiples July 2015

I am not knowledgeable enough to speculate on who may be the most likely next couplings (for what its worth, regular readers will know I think Lancashire will be a target at some stage). This article outlines who Eamonn Flanagan at Shore Capital thinks is next, with Amlin being his top pick. What is clear is that the valuation of many players is primarily based upon their M&A potential rather than the underlying operating results given pricing in the market. Reinsurance pricing seems to have stabilised although I suspect policy terms & conditions remains an area of concern. On the commercial insurance side, reports from market participants like Lockton (see here) and Towers Watson (see graph below) show an ever competitive market.

click to enlargeCommercial Lines Insurance Pricing Survey Towers Watson Q1 2015

Experience has thought me that pricing is the key to future results for insurers and, although the market is much more disciplined than the late 1990s, I think many will be lucky to produce double-digit ROEs in the near term on an accident year basis (beware those dipping too much into the reserve pot!).

I am also nervous about the amount of unrealised gains which are inflating book values that may reverse when interest rates rise. For example, unrealised gains make up 8%, 13% and 18% of the Hartford, Zurich, and Swiss Re’s book value respectively as at Q1. So investing primarily to pick up an M&A premium seems like a mugs game to me in the current market.

M&A obviously brings considerable execution risk which may result in one plus one not equalling two. Accepting that the financial crisis hit the big guys like AIG and Hartford pretty hard, the graph below suggests that being too big may not be beautiful where average ROE (and by extension, market valuation) is the metric for beauty.

click to enlargeIs big beautiful in insurance

In fact, the graph above suggests that the $15-$25 billion range in terms of premiums may be the sweet spot for ROE. Staying as a specialist in the $2-7 billion premium range may have worked in the past but, I suspect, will be harder to replicate in the future.

The Float Game Goes Into Overdrive

The IMF today warned about rising global financial stability risks. Amongst the risks, the IMF highlighted the “continued financial risk taking and search for yield keep stretching some asset valuations” and that “the low interest rate environment also poses challenges for long term investors, particularly for weaker life insurance companies in Europe”. The report states that “the roles and adequacy of existing risk-management tools should be re-examined to take into account the asset management industry’s role in systemic risk and the diversity of its products”.

In late March, Swiss Re issued a report which screamed that the “current high levels of financial repression create significant costs and lower long-term investors’ ability to channel funds into the real economy”. The financial repression, as Swiss Re calls it, has resulted in an estimated loss of $470 billion of interest income to US savers since the financial crisis which impacts both households and long-term investors such as insurance companies and pension funds.

Many market pundits, Stanley Druckenmiller for example, have warned of the destabilizing impacts of long term low interest rates. I have posted before on the trend of hedge funds using specialist insurance portfolios as a means to take on more risk on the asset side of the balance sheet in an attempt to copy the Warren Buffet insurance “float” investment model. My previous post highlighted Richard Brindle’s entry into this business model with a claim that they can dynamically adjust risk from one side of the balance sheet to the other. Besides the influx of hedge fund reinsurers, there are the established models of Fairfax and Markel who have successfully followed the “Buffet alpha” model in the past. A newer entry into this fold is the Chinese firm Fosun with their “insurance + investment twin-driver core strategy”.

The surprise entry by the Agnelli family’s investment firm EXOR into the Partner/AXIS marriage yesterday may be driven by a desire to use the reinsurer as a source of float for its investments according to this Artemis article on the analyst KBW’s reaction to the new offer. In the presentation on the offer from EXOR’s website, the firm cites as a rationale for a deal the “opportunity to exploit know-how synergies between EXOR investment activities” and the reinsurer’s investment portfolio.

Perhaps one of the most interesting articles on the current market in recent weeks is this one from the New York Times. The article cites the case of how the private equity firm Apollo Global Management purchased Aviva’s US life insurance portfolio, ran it through some legit regulatory and tax arbitrage structures with Goldman Sachs help, and ended up using some of the assets behind the insurance liabilities to prop up the struggling casino company behind Caesars and Harrah’s casinos. Now that’s a story that speaks volumes to me about where we are in the risk appetite spectrum today.

Lancashire finds the love

After going ex-dividend in November, investors went mega bearish on Lancashire (LRE.L) when it nearly dropped below the 500p level, as the graph below shows. A previous post highlighted the reasons behind the change in sentiment over the first half of 2014 on the once darling of the specialty insurance sector.

click to enlargeLancashire Insurance Group 2014 Share Price

The firm released its Q4 today and announced another special dividend of $0.50 on top of the regular $0.10 dividend. Driven by stable results, as per the graph below, and by the chatter that Lancashire could be an M&A target, the price today reflects a respectable 160% multiple to diluted tangible book. It was odd that although the firm’s executives joked about having prepared an answer to the M&A question, no analyst actually asked the question in the conference call today!

click to enlargeLancashire Historical Combined Loss 2008 to 2014

One of the big positives from the call today was the news that the firm has restructured their reinsurance programme that protects their book to give them more event coverage with reinstatements (away from previous aggregate cover). This provides more protection to Lancashire from multiple events. The PMLs as at January expressed as a percentage of the calendar year earned premiums (estimated figures for 2015) show the reduced net risk profile of this arbitrage strategy.

click to enlargeLancashire PMLs January 2015

It’s nice to see Lancashire recover some of its shine and it will be intriguing to see if it does become an M&A target in the coming months.

Same old guff

Now that the US hurricane season is over without any material events, I had a quick look over a few transcripts of conference calls in the specialty insurance and reinsurance sectors to see if there was any interesting comments on where the market is going.

Nearly everybody claims to be mitigating the challenging market conditions by ducking & diving between business classes whilst keeping their overall underwriting discipline. The softness in the reinsurance market has spread into the insurance market, albeit not to the same extent. The reality is that results continue to be flattered by reserve releases, low loss activity and improved loss trends. Market realities are slowly being reflected in ROEs which are coming down to the low double digits.

Nearly all of the reinsurers are claiming to be the winners in the structural changes in the “tiering” of the market whereby cedants are reducing their reinsurance spend and concentrating that spend amongst a select group of reinsurers. Everybody has special relationships and the gravity defying underwriters! That same old guff was the typical response in the late 1990s.

The only interesting comment that I could find was from the ever colourful Ed Noonan of Validus who, after claiming that not everybody is as disciplined as they claim (he was talking about the large generalist reinsurers), said the following:

“It’s unfortunate because the market has had such strong discipline for the last decade. There are no magical segments that are beautifully priced, and the idea that a well-diversified portfolio poorly priced risk makes sense is an economic capital model-based fantasy.”

The last sentence reminds me of one of my favourite quotes from Jim Leitner of Falcon Management that “there is no real diversification in owning a portfolio of overvalued assets“.

My view is that few economic capital models in the insurance market which are currently being used to allocate capital to business classes are taking such arguments seriously enough and most are likely over-estimating the benefit of diversification across soft or under-priced portfolios.