Category Archives: Equity Market

Judicious Volatility

The market has a tendency to take an extreme position, either everything is on the up or the sky is about to fall in. Well, fear is the flavour of the markets these days and that’s no bad thing given where we have come from. Still it’s annoying to hear the media full of hysterical noise on Ebola, the Middle East, Europe, Japan, Russia, oil, end of QE, deflation, etc. Hopefully, we’ll start to get some more considered arguments on what the medium term economic and earnings outlook may look like. Vitaliy Katsenelson had a nice piece on thinking through the effects of a few scenarios. Hopefully, the end of the happy-clappy market (it will likely not go easily and may well return before long) will lead to some more thoughtful pieces like that.

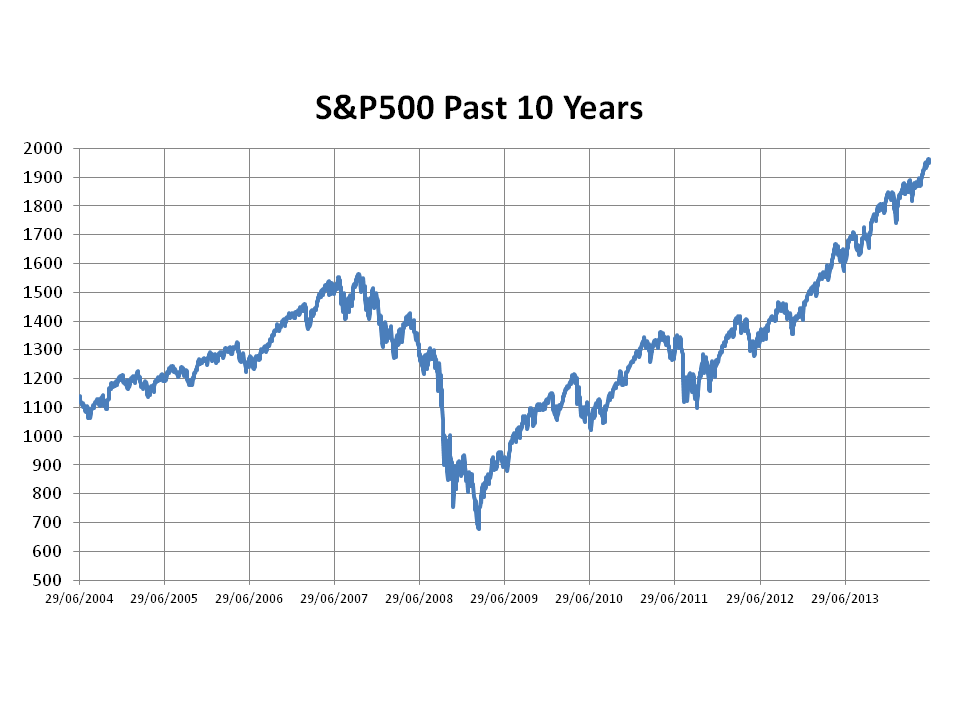
For now though, the smell of fear is in the air and the graph below on the ups and downs in the S&P500 show that the recent volatility is not even near correction territory (i.e. greater than 10% fall). In fact, we really haven’t had a proper correction since late 2011. As to whether this volatility will turn into a correction, I have no idea (I suspect it might take a while yet but it will get there).

click to enlargeS&P500 ups and downs

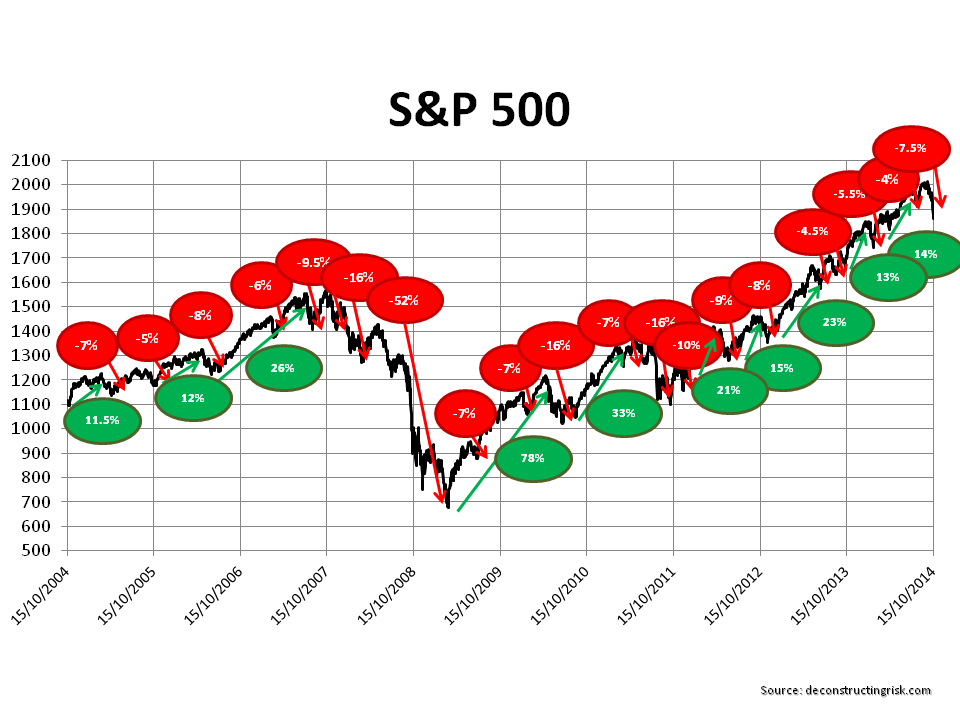
The graph below shows that the high beta stocks as measured by the Powershares high beta ETF (SPHB), as you would expect, have been hit hard here compared to the S&P500 and the low volatility ETF.

click to enlargeS&P high beta ETF

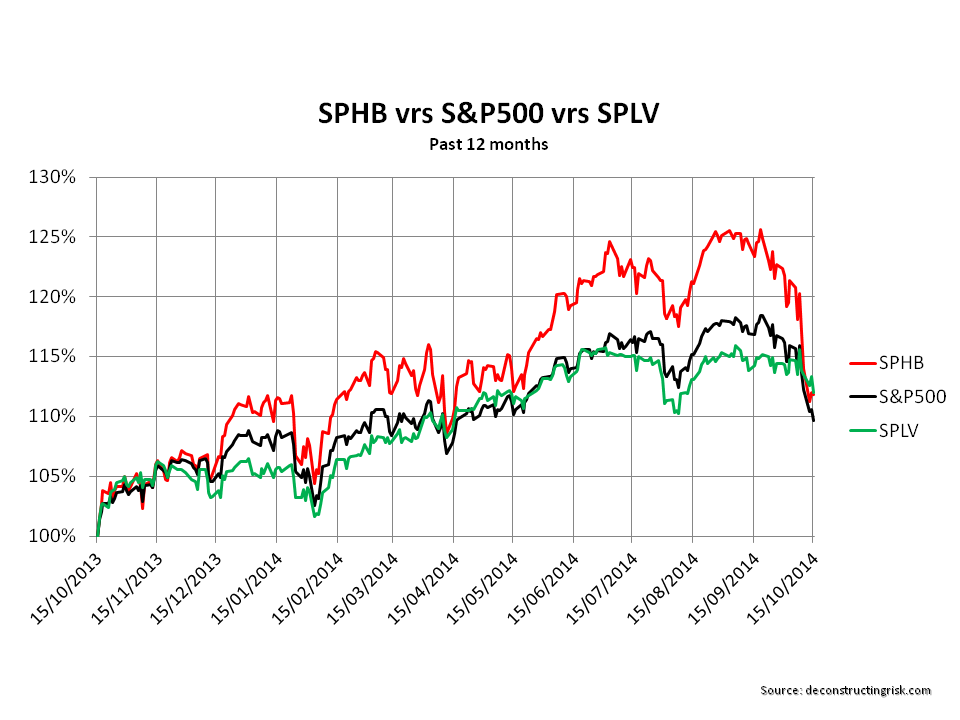
It will be interesting to see how the market develops over the coming weeks. Earnings, particularly guidance for Q4, will likely play a large part it how it plays out.

On the debate about whether historically high earnings can continue, McKinsey had an interesting article recently on the earnings and the market. The graph below from McKinsey illustrates the increased important of technology, pharma, and financials in the higher profits.

click to enlargeMckinsey Share of S&P500 profits

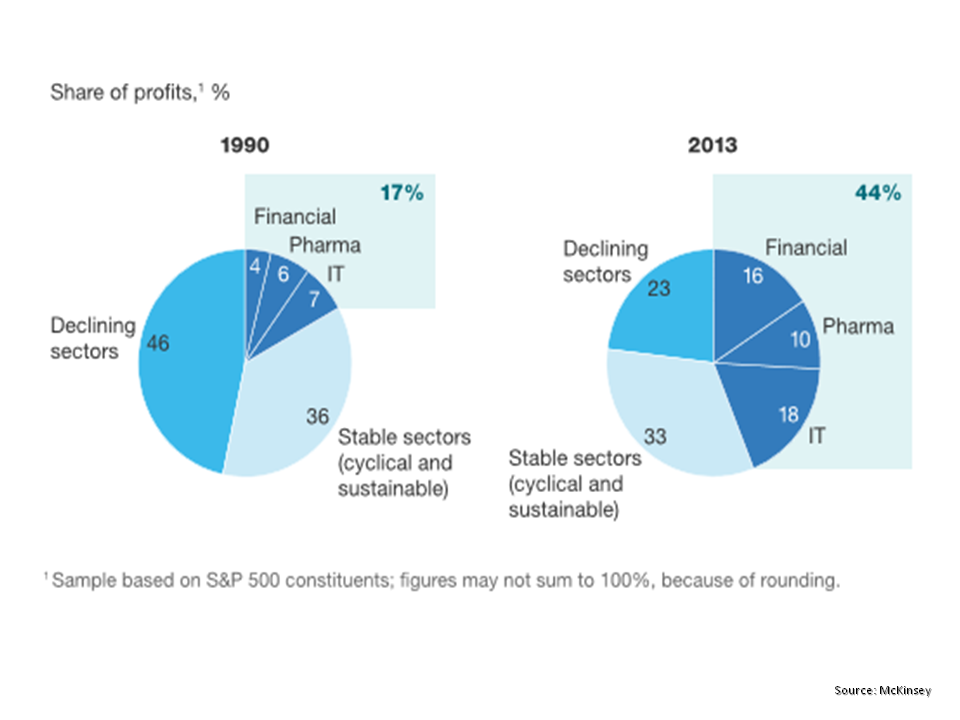
Spending time looking for thoughtful arguments on the impact of macro-economic, demographic and social pressure in today’s world on these sectors is a better way to understanding the medium term direction of the market. As McKinsey says “assessing the market’s current value ultimately depends on whether the profit margins are sustainable”. The rest is really just noise, best ignored or viewed from a distance.

An ice age or a golden one?

The debate on whether the US stock market is overvalued, as measured by the cyclically adjusted price to earnings ratio (CAPE) as developed by Robert Shiller, or whether CAPE is not relevant due to weaknesses in comparing past cycles with today’s mixed up macro-economic world, continues to rage. I have posted several times on this, most recently here and here. In an article in this week’s Economist, Buttonwood outlines some of the bull and bear arguments on the prospects for US corporate growth and concludes that “America is an exception but not as big an exception as markets suggest”.

Bulls argue that, although the CAPE for the S&P500 is currently historically high at 26.5, earnings growth remains strong as the US economy picks up speed and that at a forward PE around 16 the S&P500 is not at excessive levels indicative of a bubble. The latest statistics compiled by the excellent Yardeni Research from sources such as the Bureau of Economic Analysis show that earnings, whether S&P reported or operating earnings or NIPA after tax profits from current production or based upon tax returns, continue to trend along a 7% growth projection. Jim Paulsen, chief investment strategist at Wells Capital Management, believes that “this recovery will last several more years” and “earnings will grow”. Even the prospect of increased US interest rates does not perturb some bulls who assert that rates will remain low relative to history for some time and that S&P500 firms still have plenty of cash with an aggregate cash-pile of over $1 trillion. The king of the bulls, Jeremy Siegel recently said that “If you look at history, the bull markets do not end when the Fed starts raising interest rates. Bull markets could go on for another 9 months to 2 years“.

Bears point to high corporate profits to GDP and argue that they are as a direct result of low real wages and are therefore unsustainable when normal macro conditions return. Others point to the surge in share buybacks, estimated at nearly $2 trillion by S&P500 firms since 2009, as a significant factor behind EPS growth. Société Générale estimate a 20% fall in Q2 buybacks and (the always to be listened to) Andrew Lapthorne warns that as debt gets dearer firms will find it hard to maintain this key support to stock prices as in the “absence of the largest buyers of US equity going forward is likely to have significant consequence on stock prices”. The (current) king of the bears, Albert Edwards, also at SocGen, provided good copy in a recent report “Is that a hissing I can hear?” saying that “companies themselves have been the only substantive buyers of equity, but the most recent data suggests that this party is over and as profits also stall out, the equity market is now running on fumes“. Edwards believes that an economic Ice Age is possible due to global deflationary pressures. Another contender for king of the bears is fund manager John Hussman and he recently commented: “make no mistake, this is an equity bubble, and a highly advanced one“.

One commentator who I also respect is the author behind the excellent blog Philosophical Economics. A post last month on CAPE highlighted the obvious but often forgotten fact thatthe market’s valuation arises as an inadvertent byproduct of the equilibriation of supply and demand: the process through which the quantity of equity being supplied by sellers achieves an equilibrium with the quantity of equity being demanded by buyers”. As such, the current macro-economic situation makes any reference to an average or a “normal period” questionable. The post is well worth a read and concludes that the author expects the market to be volatile but continue its upward trajectory, albeit at a slower pace, until signs that the real economy is in trouble.

For me, the easy position is to remain negative as I see valuations and behaviour that frightens me (hello AAPL?). I see volatility but not necessarily a major correction. Unless political events get messy, I think the conclusion in a previous Buttonwood piece still holds true: “investors are reluctant bulls; there seems no alternative”. Sticking only to high conviction names and careful risk management through buying insurance where possible remain my core principles. That and trying to keep my greed in check…..

Reluctant Bulls

There was a nice piece from Buttonword in the Economist where he concluded that despite all the indicators of the equity market being overvalued that “investors are reluctant bulls; there seems no alternative”. This seems like a rationale explanation for the relatively irrational behaviour of current markets.

He highlighted indicators like the high CAPE, figures from the Bureau for Economic Analysis (BEA) on the profit dip in Q1, high share buybacks, figures from SocGen’s Andrew Lapthorne that the ratio of corporate debt to assets is close to its 2009 peak, and a BoA Merrill Lynch poll which shows that 48% of institutional investors are overweight equities whilst a net 15% believe they are overvalued.

Despite the bearish indicators everywhere, investors seem frozen by central bank indecision on whether economies still need help by remaining accommodative or that the recovery has taken hold and monetary policy needs to start to tighten.

Andrew Lapthorne released some analysis earlier this month highlighting that a significant amount of the previous year’s earnings growth was down to M&A from Verizon and AT&T and concluded that EPS growth by M&A and from share buybacks is a classic end of cycle indicator. Lapthorne produced the graph below of historical peaks and troughs in the S&P500 and noted that the average historical 1% down days is 27 per year since 1969 an the S&P500 has only had 16 in the past 12 months and that we have gone through the 4th longest period on record without a market correction of 10% or more.

click to enlarge
SocGen peak to through

Albert Edwards, also at SocGen, points to the difference in the BEA profit statistics and those reported being down to the expiration of tax provisions for accelerated depreciation and he concludes that “the bottom line is that the U.S. profits margin cycle has begun to turn down at long last“.

Even the perma-bull David Bianco of Deutsche Bank has cautioned against overvaluation calling the market complacent and moving into mania territory using their preferred measure of sentiment, namely the PE ratio divided by the VIX. The graph below from early June illustrates.

click to enlarge
DB Price Earnings VIX Ratio

From my point of view, I think the chart of the S&P500 for the past 10 years tells its own story about where we are. As Louis Rukeyser said “trees don’t grow to the sky“. Nor do equity markets.

click to enlarge

S&P500 Past 10 Years

Slim pickings in the risk premia extraction game

One of my favourite investing quotes is one from Jim Leitner in Steve Drobny’s excellent book “The Invisible Hands” where he said “investing is the art and science of extracting risk premia from financial markets over time“. Well, there is not much over-priced risk premia to extract these days!

A recent piece on CNBC highlighted the convergence in some sovereign yields as a result of Central Bank intervention in markets. The graph below shows how the 10 year government yield from Spain has converged on that of the US.

click to enlarge10 year Government Yields

In fact, todays’ yields from Italy, Spain & Ireland are within 43, 38 & 15 basis points of the US! Does it make sense from a risk perspective that these countries are so closely priced compared to the US? Clearly not, market prices are being distorted by loose monetary policy across the developed world.

In today’s FT, Martin Wolf highlights the damage that low interest rates can do over the long term (it has been 5 years now after all). He finishes the article with this paragraph:

“Low interest rates are certainly unpopular, particularly with cautious rentiers. But cautious rentiers no longer serve a useful economic purpose. What is needed instead are genuinely risk-taking investors. In their absence, governments need to use their balance sheets to build productive assets. There is little sign that they will. If so, central banks will be driven towards cheap money. Get used to it: this will endure.”

Examples of low risk premia are everywhere. From corporate spreads (as per the graph below), to the influx of capital into insurance linked securities (ILS), to inflated valuations in the stock market.

click to enlargeFRED graph high yield vrs corporate AAA

A recent Bloomberg article cites two market strategists – Chris Verrone of Strategas Research Partners and Carter Worth of Stern Agee – who recommend the purchase of insurance to protect against a stock market pullback. The article states the following:

“While we are not ready to sell stocks across-the-board — there’s still plenty of global support from central banks — we think insuring against a potential pullback makes sense. So we are buying an at-the-money put on the S&P 500 Index with a 30-day maturity. Specifically, we’re looking at the 187 strike put which expires June 6, 2014. It costs $2.54, which equates to 1.4 percent. This is a premium we’re happy to pay in order to sleep more soundly.”

As regular readers will know, I believe a cautious approach is justified in today’s market and, where risk positions have to be maintained, protection using instruments such as options should be sought (if possible). If investing is all about extracting risk premia over time and risk premia is currently mispriced across multiple markets, then the obvious thing to do is simply to go and do something else until those markets correct.

The difficulty is that central bank strategies, as Martin Wolf highlights, are centred on keeping risk premia artificially low over the medium term to stimulate growth through consumption. It is also worrying that when David Einhorn, the hedge fund manager, got to discuss longer term monetary strategy with Ben Bernanke at a dinner in March he concluded that “it was sort of frightening because the answers were not better than I thought they would be”.

Deflating Bubbles

The market is currently full of overdue anguish, with the air coming out of some of the frothier areas of the market notably in the biotech and internet sectors. To get an idea of the movements, I had a quick look at the S&P500 against a number of other indices such as the Powershares S&P high beta, S&P low volatility, & Nasdaq Internet ETFs plus the Nasdaq Biotech Index (SPHB, SPLV, PNQI & NBI respectively) as per the graph below.

click to enlargeS&P500 vrs SPHB SPLV NBI PNQI

One of the more amusing bubbles in the recent run-up has been that surrounding the creeping legalization of cannabis in the US. Penny stocks in the sector, as if straight out of “The Wolf of Wall Street”, have been rocketing. Some of the more dubious firms have jumped on the bandwagon by coming up with fanciful plans on exploiting cannabis markets after having tried their luck as software, oil exploration or even tanning companies! Firms such as CannaVest (CANV) and Vape Holdings (VAPE) have shown classic pump & dump penny stock rises and falls in recent months.

One stock that has rode both the biotech and the cannabis buddle is a UK firm called GW Pharmaceuticals (GWP.L) founded in 1998 to develop cannabinoid prescription medicines to meet patient needs under medical supervision. Their main product, Sativex, a treatment for moderate to severe spasticity is approved or near approval in a number of countries such as Norway, Israel, and Austria. Bulls point to approval in the US of Sativex and the potential for other cannabinoid products in areas such as cancer and diabetes to justify the current valuation of multiples of revenue for this loss making firm. GWP has risen from 50p last year to a high (forgive the pun!) of 400p in March with a fall back to 250p recently. Cannabis stocks offer the ultimate high for aging stoners, add in some biotech hype for GWP and the sky is the limit to a happy ever after fantasy……….will people ever learn!

To me, the deflating of sector bubbles is a very healthy sign of a rational market.  Whether an outbreak of rationality will last is another matter.