Category Archives: Investing Ideas

Consistency with ambition, the case for TWTC

Valuations remain high (S&P PE at 19.5 and CAPE over 25) despite recent volatility and I have posted on my views previously. A recent post on Level3 (LVLT) in December referred to increases in telecom valuation multiples. Since then LVLT reported a very good end to the year and has rocketed to around $38, or an approx 9.4 EV to 2014 guided EBITDA multiple (and 8.7 to my 2015 estimated EBITDA). An analyst report, whilst upgrading the stock, commented “with a focus that has shifted from a slow deleveraging exercise via acquisitions to now focusing on integration and execution of assets the company possesses, we believe we are on the cusp of a sustained outperformance”. Although I generally ignore anything analysts say, I too am bullish on LVLT over the longer term based upon the virtuous circle of improving operating results and decreasing debt. However I think valuation may have gotten ahead of itself with LVLT up 70% in 6 months. I have taken some profits to buy some downside protection. There is likely to be some bumps on the road in 2014 both for companies like LVLT and from an overall market viewpoint. Structural changes in the rapidly changing telecom market like net neutrality or the proposed Comcast/Time Warner Cable (TWC) merger may also have an impact.

Speaking of Time Warner, there is a telecom that was spun off from Time Warner in the late 1990s called TW Telecom (TWTC) that has a history over the past 10 years of outstanding execution. Over that time, TWTC has diversified itself away from its roots (top 10 customers make up 18% of revenues in 2013 compared to 23% 5 years ago and 40% 10 years ago) with a current focus on business Ethernet, data networking, IP VPN, Internet access, and network security services for enterprises. The graphic below illustrates how successful and consistent TWTC’s operating results has been. I would particularly highlight their results through the troubled 2007 to 2009 period. TWTC have had solid 35% EBITDA margins for the past 10 years with average capital expenditures of 25% as they build their last mile metro fiber network to their business customers on a success basis. Their execution is in no small measure down to one of the best (and most consistent) management teams in the business, led by long term CEO Larissa Herda.

click to enlargeTW Telecom a history of consistent operating results

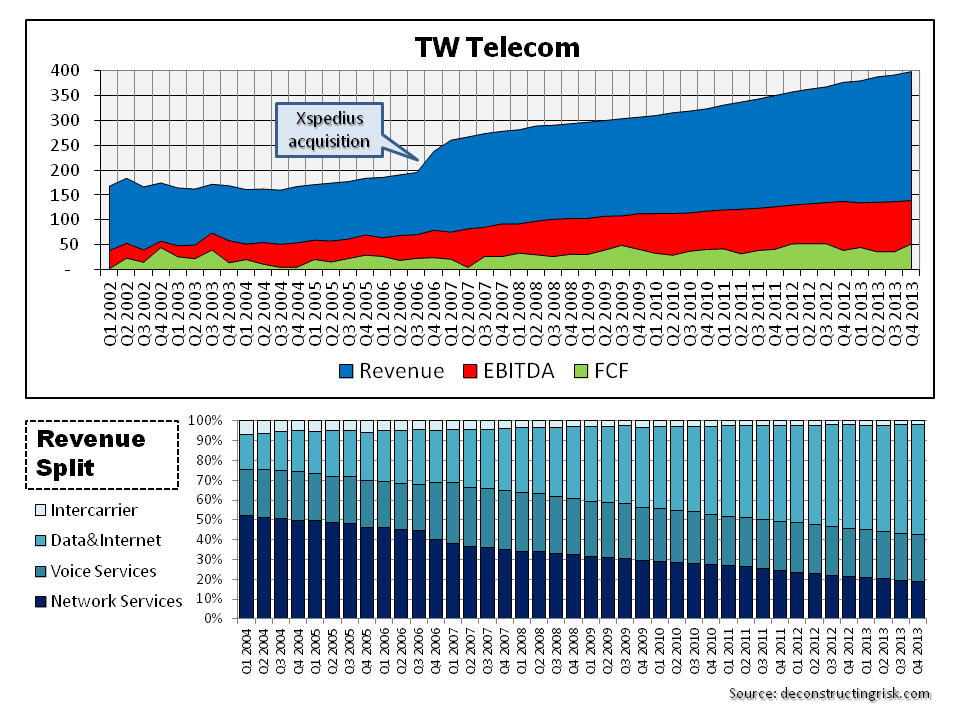
In addition to solid operating results, TWTC have always shown disciplined balance sheet management with net debt well below 2 times EBITDA in the past 5 years (except for 2013 at 2.3 times as per the changes below). As a result of the factors highlighted above, TWTC has always enjoyed a premium valuation multiple in the market as the graph (of enterprise value to twelve month trailing (TTM) and future twelve months (FTM) EBITDA) below shows.

click to enlargeTW Telecom EV to EBITDA Multiples

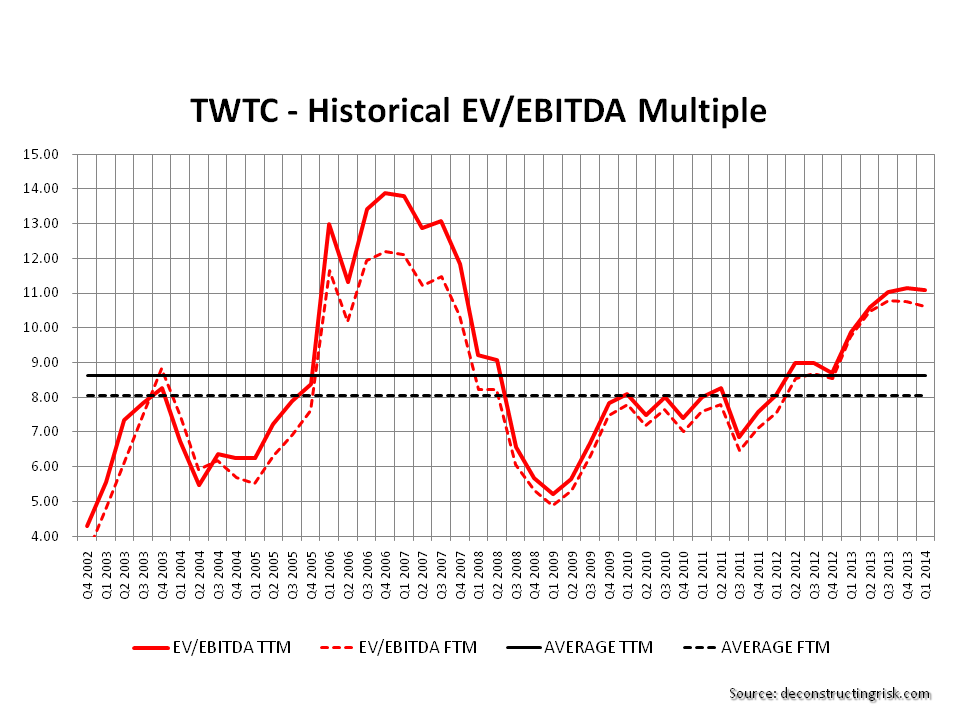
TWTC has long been talked of as an acquirer or a target for others but nothing of substance has materialised since their Xspedius acquisition back in 2006. The firm has increasingly undertaken shareholder friendly actions such as the $400 million spend on its own shares in 2013. TWTC has also bought back convertible debt and pushed out the maturities on its debt which has increased from YE2012 of $1.76 billion to just below $2 billion as at YE2013.

The reason for the increase in debt plus an additional one-off capital expenditure of $120 million in 2013 on capital leases (not included in graph above), with another one off $50 million due in 2014, is a strategic market expansion announced by TWTC in late 2013. The strategic market expansion is to extend its metro fiber footprint into 5 new high demand markets and accelerate the density of its metro-fiber footprint in 27 existing markets by 17%. Given TWTC’s history of execution, their plans for expansion and the (almost giddish) optimism of management during their Q4 conference call caught my attention. These are people who have not make such promises lightly in the past.

One of the factors behind their expansion is the success of new product innovation introduced in 2012, namely products called Enhanced Management and Dynamic Capacity. Such products allow enterprises to automate, manage and purchase network capacity on a flexible real time framework based upon their needs and offer flexibility in accessing connections to private, hybrid and public clouds. TWTC refer to their state of the art network as the Intelligent Network and are marketing their range of products on the basis of what they call their Constellation Platform which “will connect our customers nearly instantaneously through data centers directly to numerous applications in the cloud with increasing network automation”. All of these fancy products names and high minded assertions shouldn’t in themselves be taken as anything earth shattering in the rapidly changing IT and telecom market. What may be special is that TWTC has indicated increased interest in their offerings and that, through partnerships with cloud providers such as Amazon, they are getting interest from new enterprises with big data needs . TWTC state that their expansion is “a very targeted opportunity to rapidly increase our market density to drive additional revenue growth and greater cash flow” and that it “is all part of our broader vision of bringing better, faster and easier solutions to customers as we continue to innovate and create market differentiation”.

Given the history of execution by TWTC’s management, I would be positive on their ability to deliver on their promises. They have indicated that EBITDA margins will be under pressure in 2014 as they staff up for the new expansion. For 2015 & 2016, EBITDA expansion of 10% to 15% does not seem unreasonable to me based upon my calculations. Given a current EV/EBITDA on a TTM basis of over 11, TWTC is not cheap and, as stated in the beginning of this post, there are likely to be bumps in the road over 2014. Such bumps may provide an opportunity to back TWTC and its expansion at an attractive valuation.

I, for one, will be looking out for it.

Lancashire…so much to answer for.

My bearishness on the reinsurance and specialty insurance sector is based upon my view of a lack of operating income upside due to the growing pricing pressures and poor investment income. I have posted many times (most recently here) on the book value multiple expansion that has driven valuations over the past few years. With operating income under pressure, further multiple expansion represents the only upside in valuations from here and that’s not a very attractive risk/reward profile in my view. So I am happy to go to the sidelines to observe from here.

So, what does this mean for my previously disclosed weak spot for Lancashire, one the richest valued names in the sector? Lancashire posted YE2013 results last week and disappointed the market on the size of its special dividend. As previously highlighted, its Cathedral acquisition marked a change in direction for Lancashire, one which has confused observers as to its future. During the conference call, in response to anxious analysts, management assured the market that M&A is behind it and that its remains a nimble lead specialist high risk/high return underwriter dedicated to maximising shareholder returns from a fixed capital base, despite the lower than expected final special dividend announced for 2013.

The graph below illustrates the past success of Lancashire. Writing large lead lines on property, energy, marine and aviation business has resulted in some astonishingly good underwriting returns for Lancashire in the past. The slowly increasing calendar year combined ratios for the past 5 years and the lack of meaningful reserve releases for the past two year (2013 even saw some reserve deterioration on old years) show the competitive pressures that have been building on Lancashire’s business model.

click to enlargeLancashire Combined Ratio Breakdown 2006 to 2013

The Cathedral acquisition offers Lancashire access to another block of specialist business (which does look stickier than some of Lancashire’s business, particularly on the property side). It also offers Lancashire access to Lloyds which could have some capital arbitrage advantages if Lancashire starts to write the energy and terrorism business through the Lloyds’ platform (as indicated by CEO Richard Brindle on the call). Including the impact of drastically reducing the property retrocession book for 2014, I estimate that the Cathedral deal will add approx 25% to GWP and NEP for 2014. Based upon indications during the call, I estimate that GWP breakdown for 2014 as per the graph below.

click to enlargeLancashire GWP Split

One attractive feature of Lancashire is that it has gone from a net seller of retrocession to a net buyer. Management highlighted the purchase of an additional $100 million in aggregate protection. This is reflected in the January 1 PML figures. Although both Lancashire and Cathedral write over 40% of their business in Q1, I have taken the January 1 PML figures as a percentage of the average earned premium figures from the prior and current year in the exhibit below.

click to enlargeLancashire PMLs January 2010 to January 2014

The graphs above clearly show that Lancashire is derisking its portfolio compared to the higher risk profile of the past two years (notably in relation to Japan). This is a clever way to play the current market. Notwithstanding this de-risking, the portfolio remains a high risk one with significant natural catastrophic exposure.

It is hard to factor in the Cathedral results without more historical data than the quarterly 2013 figures provided in the recent supplement (another presentation does provide historical ultimate loss ratio figures, which have steadily decreased over time for the acquired portfolio) and lsome of the CFO comments on the call referring to attritional loss ratios & 2013 reserve releases. I estimate a 68% combined ratio in 2014, absent significant catastrophe losses, which means an increase in the 2013 underwriting profit of $170 million to $220 million. With other income, such as investment income and fee income from the sidecar, 2014 could offer a return of the higher special dividend.

So, do I make an exception for Lancashire? First, even though the share price hasn’t performed well and currently trades around Stg7.30, the stock remains highly valued around 180% tangible book.  Second, pricing pressures mean that Lancashire will find it hard to make combined ratios for the combined entities significantly lower than the 70% achieved in 2013, in my view. So overall, although Lancashire is tempting (and will be more so if it falls further towards Stg7.00), my stance remains that the upside over the medium term does not compensate for the potential downside. Sometimes it is hard to remain disciplined……

A Changing Education

Anybody who has young kids at school knows the incredible impact that the internet is having upon modern education. My kids love Reading Eggs, a spelling game by a company called Edmentum. Others rave about Edmodo, a free online platform for teachers and students with over 17 million users worldwide.

The digitalization of education content and the multitude of new online learning platforms are resulting in a substantive change in the education of our kids. A recent study of online learning found that, on average, students performed better than those receiving face-to-face instruction. Technology also offers an array of tools for teachers to monitor student’s learning and to highlight specific issues with students. John Fallon, the CEO of Pearson Plc, believes online learning is a “once-in-a-generation opportunity” and could be “one of the great growth industries of the future”.

Coupled with my kids’ interest in the latest learning game (when they are not playing Minecraft!), the re-emergence of a company called Houghton Mifflin Harcourt (HMHC) from bankruptcy in 2012 and its return onto the stock market in November 2013 has caught my attention. The rise and fall of HMHC over the past decade, a leading provider to the kindergarten through twelfth grade (called the K-12 market) educational sector in the US, is a fascinating case study on the effect of the financial crisis coupled with the disintermediating impact of technology.

Before looking through HMHC’s past the exhibit below outlines the market leaders in the education sector according to a presentation from Pearson Plc.

click to enlargeEducation Market

The firms above are from a cross section of the industry, some focus on adult education, others on universities, whilst others on the K-12 market. The main firms in the K-12 sector are Pearson Education, McGraw Hill Education, HMHC, Cengage Learning, Scholastic Corporation and K12 Inc.

The educational textbook market has been struggling with declining sales. Cengage Learning filed for Chapter 11 bankruptcy last year and the private equity firm Apollo are known to be looking for an exit from its purchase of McGraw-Hill Education in 2012. The graphic below shows the share history of a number of the firms (from 2008 for many and from 2011 for a larger sample).

click to enlargeEducation Stocks

As can be seen, the experience has been decidedly mixed with only Pearson achieving an acceptable long term performance (although it was hit recently by a profits warning in January due to poor US sales, particularly in the career college sector).

Houghton Mifflin has a long history in publishing going back to the 19th century.  A public company since 1967, Houghton Mifflin was bought by Vivendi in 2001 for $2.2 billion and, following financial issues in Vivendi, resold in 2002 for $1.7 billion to a number of private equity firms. By 2005, Houghton Mifflin had revenues of $1.3 billion with an EBITDA margin of 23%.

Riverdeep was an Irish educational technology firm taken public in 2000 at the height of the internet boom by its then 30 year old CEO Barry O’Callaghan. O’Callaghan had a background in investment banking firms such as Credit Suisse where he had developed his deal-making and financial engineering skills. He took Riverdeep private after the internet crash and by 2005 Riverdeep had revenues of $140 million and an EBITDA margin around 50%.

In 2006, O’Callaghan orchestrated an audacious merger of Houghton Mifflin and Riverdeep, an old and a new firm in educational content. The deal involved $600 million of new equity with the merged entity leveraged with $3.5 billion of debt. In the deal, Houghton Mifflin was valued at 10 times 2006 forecasted EBITDA whilst Riverdeep got a 13 times multiple.  The investment case for the deal was to use Riverdeep’s technological experience to drive new revenue opportunities for Houghton Mifflin’s content whilst cutting costs through supply chain optimization and outsourcing. Barely within a year of the deal, the merged Houghton Mifflin Riverdeep again went on the M&A trail. This time it purchased Harcourt Education, another significant player in the K-12 market, for $4 billion. The idea was to resell on a number of non-core units of the combined entity  such as the College division (sold to Cengage Learning for $750 million) and Harcourt Religion Publishing to focus on the K-12 market.

The new company, which operated under the name Houghton Mifflin Harcourt, looked at quickly taking out the targeted $250 million of annual costs froml the combined entities (for example, printing was outsourced) and focusing on leveraging existing content in an online learning environment. Houghton Mifflin Harcourt increased market share and performed well in the first half of 2008 before the financial crisis started to take hold. For the full 2008 year, revenue was $2 billion down approx 5% from the 2007 proforma figures but, due to the impact of cost savings, EBITDA grew substantially to over $700 million and an impressive EBITDA margin of over 35%. The firm remained highly leveraged with debt of over $6.25 billion or over 8 times as at the end of 2008. The new Houghton Mifflin Harcourt was heading into a storm, the like of which had never been seen before in the sector.

The impact of the financial crisis wreaked havoc on the firm’s business as local State finances resulted in a sharp rise in postponed and deferred sales. Education textbook and material purchases are seasonal with particular liquidity strains on the business in Q1 and Q4. By mid-2009, the company announced a debt restructuring to reduce debt by over $1 billion. However, trading conditions continued to deteriorate in H2 2009 and the full year recorded a 25% reduction of revenue and a reduction in EBITDA of over 30%. Houghton Mifflin Harcourt ended 2009 with an estimated debt to EBITDA ratio of over 13 which was clearly unsustainable. A question mark loomed over it’s future.

In early 2010, a recapitalization involving a debt for equity swap and new investment of $650 million was agreed which reduced the firm’s debt load to below $3 billion and wiped out the existing equity holders. Paulson & Co and Guggenheim Partners were amongst the new owners. Astonishingly, Barry O’Callaghan kept his job as CEO after the recapitalization.

In the US, educational products are split into 2 categories – basal and supplemental. Basal materials are complete materials for students and teachers covering comprehensive courses. Supplemental materials speak for themselves. Approximately half of the States in the US follow a State wide adoption of basal materials by subject, usually ever 3 to 5 years (and are called “Adoption States”). The others allow districts to select their own course materials and are called “Open States”. Important adoption States in the K-12 market include the largest – Florida, Texas and California.

Unfortunately for Houghton Mifflin Harcourt, the impact of the financial crisis on education budgets was not yet over, as an exhibit below on State finances from a presentation by the Partheneon Group compared to basal and supplemental sales illustrates.

click to enlargeUS K-12 Basal & Supplemental Market

Houghton Mifflin Harcourt classifies their education products are follows:

  • Comprehensive Curriculum which are materials for a complete study course, either at single of multi grade level and include subjects like reading, literature/language arts, mathematics, science, world languages and social studies.
  • Supplemental Products which are materials to assist learning through incremental instruction.
  • Heinemann produces professional books and developmental resources aimed at empowering pre-K-12 teachers whilst also providing benchmarking assessment tools.
  • Professional Services provide consulting services to assist school districts in increasing accountability & training services.
  • Riverside Assessment products provide district and state level solutions including psychological and special needs testing to assess intellectual, cognitive and behavioral development.
  • International products are educational solutions in high growth territories primarily in Asia, the Pacific, the Middle East, Latin America, the Caribbean and Africa.

HMHC’s other business is the traditional trade publishing business with recent titles such as The Hobbit and Life of Pi.

In 2011, Houghton Mifflin Harcourt was particularly impacted by a reduction in spending by Texas, one of the largest spending States, with revenues from Texas down from $190 million in 2010 to $70 million in 2011. The graphic below shows the business split by the above product classification for 2010 to 2012. The EBITDA margin is also shown (interestingly its averaging in the mid twenties at a level very similar to that achieved by the stand alone Houghton Mifflin in 2005!).

click to enlargeHoughton Mifflin Harcourt 2010 to 2012 Results

In September 2011, Linda Zecher took over as CEO from O’Callaghan who left the business. Zecher previously held leadership roles at Microsoft, Texas Instruments, and Peoplesoft. She has reorganised the executive suite, bringing in new expertise, many from Microsoft or with extensive technology backgrounds. In June 2012, Houghton Mifflin Harcourt emerged from voluntary bankruptcy under Chapter 11 with a cleaned up balance sheet with debt as at YE 2012 of less than $250 million and cash of over $450 million (cash balance is down to $230 million as at Q3 2012 with debt at the same level). Over the recent past, the business has been relatively steady if nothing spectacular.  For FY2013, the business is likely to run at an operating breakeven, cashflow positive, with a EBITDA margin in the mid-20s. HMHC currently trades at an EV/EBITDA multiple of 7.5 which seems reasonable. They report their FY results in early March. The graphic below shows quarterly revenues since 2011.

click to enlargeHoughton Mifflin Harcourt Quarterly Revenue

The company went public again in November 2013 under the ticker HMHC and points to its new found financial strength, its experience in digitalising its products, favourable demographics and the need for key States to adopt new programmes as catalysts. Florida, California and Texas are all scheduled to adopt educational materials for certain subjects between 2013 and 2016.

One important development that will determine the future success of firms such as HMHC is the newly developed Common Core State Standards agreed by State governors with implementation scheduled to begin in the 2014-2015 school year. Some, such as HMHC, argue that the long established firms with proven content and relationships will benefit the most from such standardisation. Others see these new standards as offering newer firms the opportunity to compete and innovate. The Partheneon Group, in the presentation referenced above, contend that digital disintermediation offers multiple content providers the opportunity to see their products if a common framework can be established, as the graphic below shows. Firms like Apple and Google are active in the education sector and would love to position themselves as such a platform.

click to enlargeDigital Disintermediation

The future of companies such as HMHC may be uncertain but it will be interesting to observe how it plays out for them. Given HMHC’s recent experiences, I wish them well. Battle hardened now; they look in better shape than some of their old school competitors.

In some ways, you have to admire the vision of people like O’Callaghan for trying to pre-empt the future back in 2007. It is debatable whether the company would have survived with such an inflexible debt load in such a fast moving environment even without the financial crisis. To add the pressure of excessive leverage makes the task look foolhardy in retrospect.

COLT needs to show more progress

There has been an outburst of deal activity in European cable markets with Vodafone and Liberty Global squaring up on Spain’s Ono. Other European cable assets such as Com Hem, Get AS, and Galicia in Sweden, Norway and Spain respectively are reportingly also up for sale. Despite the economic woes in Europe and the regulatory uncertainty across the broader European telecom sector, valuations relative to the US have improved in 2013 returned to close to historical averages around 6 times EBITDA. The European incumbents are expected to see stabilisation, or at least a slowdown in decline, of revenue in 2014 and many are hoping that the environment is becoming more conducive to the long predicted European consolidation.

Against this background, I had a quick look over COLT Group SA, previously COLT Telecom, one of the start-up pan European telecoms from the heady days of the telecom bubble in the late 1990s/early 2000s. A previous post on the telecom sector touched on the past of COLT and the graph below shows the firm’s operating history to YE2012 and illustrates the pressure on cash-flow (e.g. EBITDA less capital expenditure) as a result of the changes COLT have undertaken since the mid-2000s to focus on being a pure pan-European data and managed services provider.

click to enlargeCOLT 2003 to 2012 Operating History

Digging a bit deeper, the breakdown of revenue by source shows that COLT has been making progress in reducing their exposure to lower margin voice revenues. However, annualising H1-2013 results shows that progress on EBITDA margins has slowed in the highly competitive sector and that returns on investment have yet to materialise operationally in a significant manner.

click to enlargeCOLT 2006 to H12013 Revenue Breakdown & EBITDA Margin

COLT is debt free but cash has reduced to €160 million as at Q3 (from €280m at YE 2012 & €340m at YE 2011) due to data centre infrastructure expense. COLT’s valuation, at below 5 times EBITDA, is less than many in the sector and also below recent acquisition multiples such as Deutsche Telecom’s purchase of GTS Central Europe for approx 6.3 times EBITDA. However, for me, recent sluggish revenue growth and EBITDA margins show that COLT still has much to prove in demonstrating the success of its investment in its strategy.

On the upside, a firm like COLT may get caught up in M&A speculation with someone like Vodafone looking to buy fixed line assets in Europe.

A look over some bookmakers’ books

I have been doing some digging into the dynamics of betting exchanges, the largest and best known of which is BetFair. The betting and gaming sector itself has been the subject of a mountain of academic research, there is even a journal dedicated to it! Quants have moved in and are actively pitting their algorithms against human gambling behaviour on the exchanges. A recent intriguing Bloomberg article on tennis betting illustrates some strategies now common in the marketplace.

Technology has driven disruptive disintermediation across many sectors such as the travel & airline industry and more recently across the retail sector. There was a fascinating documentary on the BBC by Robert Preston late last year on the UK retail sector which concluded that the future for many clothing retail outlets would be to act like galleries for consumers to peruse items with the ultimate purchase decision being made online.

The betting and gaming sector is one undergoing structural changes due to the massive increase in online activity. Additional competitive threats from disintermediated business models such as betting exchange pose interesting questions for the sector. Such structural market changes may be useful in understanding the impact of new business models in other sectors such as financial services –  peer to peer (P2P) lending in banking or the ILS market in insurance come to mind. On the growing P2P lending sector, there was an article on the front page of Friday’s FT on how a UK developer sourced £4 million of debt through online P2P platform Lendinvest which may prove to be defining moment of change. On the impact of the ILS market, there was another interesting FT article that contended that the ILS market is resulting in structural changes in a market with “a lot of excessive overhead, ie highly paid staff, that can be eliminated”.

Before looking deeper into structural changes in the betting and gaming sector, I needed to understand the “traditional” betting market better. Besides the odd poker tournament (with real people), I am not a gambler and therefore not a user of the services provided by betting firms. I know enough that the odds are obviously in the bookies favour but I know very little about the economics of the betting industry. As such, this post details my research on the UK betting industry. A follow on post will go into the broader picture and some (likely rambling) thoughts on the impact of structural changes from betting exchanges like Betfair.

So, I concentrated on the UK market where data is freely available. The graphic below outlines the size of the UK betting and gaming market with the main providers. The market is split by revenue approx 60% retail and 40% online. The retail market is split approx 50:50 between over the counter betting at shops and gaming on machines (aka fixed odds betting terminals or FOBTs). On the online side, sports betting (commonly referred to as the Sportsbook) is approx 40% with gaming making up the remainder, led by casino (approx 30%), poker and bingo (approx 15% each).

click to enlargeUK Gambling Market Size

The main players on the retail side stress the advantages of their multi-access models and, to counter the impression that retail betting shops attach the older demographic, cite statistics that show even younger customers often use retail outlets (more and more in combination with online and mobile).

The gaming machine/FOBT sector has come under renewed focus recently. Derek Webb, a successful gambler, is one of the principles behind the Campaign for Fairer Gambling and has described the machines as “crack cocaine”. Campaigners point to the rapid rise in revenue from FOBT, which were only widely introduced in the early 2000s, the addictive nature of the machines and that users are high frequency gamblers with a concentration amongst younger men with low incomes. Bookies point to the high payouts (the margin taken by the bookmaker is generally about 3% to 4% of the amount staked whereby such margin is referred to as the gross win) and the importance of machines supporting the retail shop model (I estimate that FOBT can contribute 70% to 80% of retail operating profits). Political pressure is mounting to restrict the amount that can be bet on the machines and JP Morgan recently cut its rating on Ladbrokes and William Hill saying that the likely change “could make the bottom 20pc of Ladbrokes and William Hill shops loss-making, with a further 20pc only marginally profitable, and require significant restructuring to close shops in order to cut costs.

I selected Ladbrokes, William Hill and Paddy Power as firms to do some deeper analysis. William Hill and Ladbrokes are long established firms, particularly in the retail sector. William Hill is also the market leader in the online sector with a particular strength in online casino gaming. Paddy Power is the new kid on the block growing aggressively in online, particularly over the past 5 years, from its Irish base into the fourth largest in the online sector. Size wise, William Hill and Ladbrokes had revenue of £1.3 billion and £1 billion in 2012 respectively while Paddy Power had 2012 revenue of €650 million (approx £570 million). It would have been interesting to have a deeper look at the online only Bet365, which was founded in 2000 by Denise Coates and is now the number 2 in the UK online market with over £200 million in revenue, but unfortunately Bet365 is private. The graph below shows the share price moves of the selected firms since 2009.

click to enlargeShare Price William Hill Ladbrokes Paddy Power

The graph below shows the profit before tax margins of the firms since 2003. As can be seen, profit margins have been under pressure, particularly for Ladbrokes in recent years.

click to enlargePBT % William Hill Ladbrokes Paddy Power

Revenue and operating profit breakdown for William Hill is below.

click to enlargeWilliam Hill Revenue & Operating Profit Breakdown

Revenue and operating profit breakdown for Ladbrokes is below.

click to enlargeLadbrokes Revenue & Operating Profit Breakdown

Revenue and operating profit breakdown for Paddy Power is below.

click to enlargePaddy Power Revenue & Operating Profit Breakdown

As mentioned above, the percentage that a bookmaker takes as a margin in each business is called the gross win (another commonly used term is the overround which refers to the excess above the sum of the odds). Net revenues are gross wins less VAT and fair-value adjustments for free bets, promotions and bonuses. Care needs to be taken when comparing gross win percentages (i.e. gross win divided by amounts staked) across firms as the make-up of the underlying books is important (gross wins varies by sport type such as football, horses, tennis, etc and by geography). Also items such as betting levies and charges vary and some are not deducted in the gross win to net revenue calculations but rather in operating expenses. Items such as the new UK point of consumption (POC) tax that is due to be introduced later this year also need to be understood in their potential accounting treatment. The graph below compares the reported gross win percentages amongst the firms in the retail over the counter (OTC) business and in the online Sportsbook businesses for the firms.

click to enlargeGross Win Percentage

I have found it difficult to get metrics for the profitability of both the retail and the online gaming businesses. As discussed above on the FOBT business, the operating profit contribution from gaming can be significant. I suspect that online gaming also contributes significantly to the online operating profit although not as high as the 70% to 80% contribution that I estimated for the retail business

Online gaming is also a more cross border business and is the fastest growing segment of the gambling industry. H2 Gambling Capital, a leading supplier of data and market intelligence on the global gambling industry, puts the size of the global online gaming market at approx $30 billion. Large markets such as the US are seen as ultimately providing a massive opportunity for growth once regulatory issues are resolved. Although firms withdrew from the US in 2006 after the passing of the Unlawful Internet Gambling Enforcement Act (UIGEA), individual States such as Nevada and New Jersey are looking at ways that they can approve online gaming and challenge federal restrictions.

Although the established firms like William Hill and Ladbrokes are facing headwinds in their business with significant competition from online upstarts like Paddy Power, Bet365 and Betfair, they have size and powerful brands on their side. Both have made significant investments in IT infrastructure to support their business. The area of liability management is one that is particularly interesting. Ladbrokes, for example, has made significant investment in enhancing their trading abilities through the development of Morse, their own algorithmic robot. They cite the use of Morse in improving pricing which is particular important in the growing bet in play (BIP) market, as the exhibit shows.

click to enlargeLadbrokes Pricing & Trading Exhibit 2012 Investor Day

They also cite the use of such active liability management tools in improving outcomes such as the Royal Ascot results below.

click to enlargeLadbrokes Liability Management Exhibit 2012 Investor Day

Changes in the whole betting and gaming sector have been rapidly evolving over recent years. These changes and the impact of betting exchanges will be the subject of a follow on post with some further musings in the coming weeks.