Why Liquidity Rules

Businesses with strong cash-flow are rightfully held in high esteem as investments. Google and Apple are good examples. Betting/gambling firms and insurers (in non-stressed loss periods) are other examples of businesses, if properly run, that can operate with high positive cash-flow.

The banking sector is at a completely different end of the spectrum as liquidity transformation is essentially the business. Everybody knows of Lehman Brothers bankruptcy, which was instigated in late 2008 by an immediate need to find $3 billion of cash to meet its obligations. The winding-up of the Lehman Brothers holding company in the US is estimated to return approximately 26 cents on the dollar according to this FT article.  It was therefore a surprise to read in the FT article and in another recent article on the expected surplus of £6 to £7 billion from the winding up of Lehman Brothers operation in London after all of the ordinary creditors have been repaid in full. This outcome is particularly surprising as I understood that the US operation of Lehman did a cash sweep across the group, including London, just prior to entering bankruptcy.

In his book (as referenced in this post), Martin Wolf highlights the changing perceptions of value since the crisis by using ABX indices from Markit which represent a standardized basket of home equity asset backed securities. The graph below shows the value for one such index, the ABX.HE.1, to the end of 2011. These indices are infamous as they were commonly used to value securities since the crisis when confidence collapsed and can be used to demonstrate the perils of mark to market/model accounting (or more accurately referred to as mark to myth values!).

click to enlargeMarket Value Asset Backed Subprime Index

I have included the more recent values of similar ABX indices in the bubbles as at last year from Wolf’s book. This graph accentuates the oft used quote from Keynes that “the market can remain irrational longer than you can remain solvent”.

Wolf argues that the 3% liquidity ratio proposed under Basel III or indeed the 5% proposed in the UK are totally inadequate and he suggests a liquidity ratio closer to 10%. On capital ratios, Wolf argues for capital ratios of 20% and above with a strong emphasis on tier 1 type equity or bail-inable debt that automatically converts. This contrasts against the 6% and 2.5% of tier 1 and 2 capital proposed respectively under Basel III (plus a countercyclical and G-SIFI buffer of up to 5%). Wolf also highlights the bankers ability to game the risk weighted asset rules and suggests that simple capital ratios based upon all assets are simpler and cleaner.

Wolf supports his arguments with research by Bank of England staffers like David Miles1 and Andrew Haldane2 and references a 2013 book3 from Admati and Hellwing on the banking sector. Critics of higher liquidity and capital ratios point to the damage that high ratios could do to business lending, despite the relatively low level of business lending that made up the inflated financing sector prior to the crisis. It also ignores, well, the enormous cost of the bailing out failed banks for many tax payers!

For me, it strengthens the important of liquidity profiles in investing. It also reinforces a growing suspicion that the response to the crisis is trying to fix a financial system that is fundamentally broken.


  1. Optimal Bank Capital by David Miles, Jing Yang and Gilberto Marcheggiano
  2. The Dog and the Frisbee by Andrew Haldane
  3. The Bankers New Cloths by Anat Admati and Martin Hellwing


Path of profits

The increase in corporate profits has been one of the factors behind the market run-up (as per posts such as here and here from last year). McKinsey have a new report out called “Playing to win: The new global competition for corporate profits” that predicts a decrease of the current rate of 10% of global GDP back to the 1980 level of below 8% by 2025.

Factors that McKinsey cite for the decline are that the impact of global labour arbitrage and falling interest rates have reached their limits. McKinsey also predict that competitive forces from 2 sources will drive down profits, as per the following extract:

“On one side is an enormous wave of companies based in emerging markets. The most prominent have been operating as industrial giants for decades, but over the past ten to 15 years, they have reached massive scale in their home markets. Now they are expanding globally, just as their predecessors from Japan and South Korea did before them. On the other side, high-tech firms are introducing new business models and striking into new sectors. And the tech (and tech-enabled) firms giants themselves are not the only threat. Powerful digital platforms such as Alibaba and Amazon serve as launching pads for thousands of small and medium-sized enterprises, giving them the reach and resources to challenge larger companies.”

Interesting graphs from the report included those below. One shows the factors contributing to the rise in US corporate profits, as below.

click to enlargeMGI Historical US Corporate Profit Components 1980 to 2013

Another graph shows the variability and median return on invested capital (ROIC) from US firms from 1964 to 2013, as below.

click to enlargeMGI Historical ROIC US Corporates 1964 to 2013

Another shows the reduction in labour inputs by country, as below.

click to enlargeMGI Labor Share of Total Income 1980 to 2012

Another shows the growth in corporate sales by region from 1980 to 2013, as below.

click to enlargeMGI Global Corporate Sales By Region

Another shows the ownership and the ROIC profile of the new competitors, as below.

click to enlargeMGI The New Competitors ownership split & ROIC by region

And finally the graph below shows McKinseys’ projections for EBITDA, EBIT, operating profit, and net income to 2025.

click to enlargeMGI Global Corporate Profits 1980 2013 2025

Hot Take-outs

In many episodes of fervent investment activity within a particular hot spot, like the current insurance M&A party, there is a point where you think “really?”. The deal by Mitsui Sumitomo to take over Amlin at 2.4 times tangible book is one such moment. A takeover of Amlin was predicted by analysts, as per this post, so that’s no surprise but the price is.

With the usual caveat on the need to be careful when comparing multiples for US, Bermuda, London and European insurers given the different accounting standards, the graph below from a December post, shows the historical tangible book value levels and the improving multiples being applied by the market to London firms such as Amlin.

click to enlargeHistorical Tangible Book Multiples for Reinsurers & Specialty Insurers

Comparable multiples from recent deals, as per the graph below, show the high multiple of the Mitsui/Amlin deal. Amlin has a 10 year average ROE around 20% but a more realistic measure is the recent 5 year average of 11%. In today’s market, the short to medium term ROE expectation is likely to be in the high single digits. Even at 10%, the 2.4 multiple looks aggressive.

click to enlargeM&A Tangible Book Multiples September 2015

There is little doubt that the insurance M&A party will continue and that the multiples may be racy. In the London market, the remaining independent players are getting valued as such, as per the graph below tracking valuations at points in time.

click to enlargeLondon Specialty Insurers Tangible Book Values

When the hangover comes, a 2.4 multiple will look even sillier than its does now at this point in the pricing cycle. In the meantime, its party like 1999 time!

Summer Blues

After the holidays, it’s time to pack the bucket and spades away and get back into the routine. It has been a volatile August.  A bear call in a post in early May is looking pertinent (as is the post on a suggested tie-up between Paddy Power and Betfair!) given the 7% drop in the S&P500 since then, although it is more likely dumb luck.

The market concern is centred on the prospects for China’s economy. Growth is widely believed to be a lot lower than the official 7% with exports down, concerns about zombie loans and the political ramifications of managing a lower growth economy. The Economist, in an article this week, highlighted the potential impact of a slow-down in China and other emerging markets on global growth, as per the graph below.

click to enlargeGlobal GDP Growth Breakdown 1980 to 2015

Amongst the usual holiday reading, I brought two books on economics for the beach. The first was the FT’s Martin Wolf’s “The shifts and the shocks” from late in 2014 and the second is the recently published “Postcapitalism” by Paul Mason. Although often a laboured read, I did manage to finish the former whilst I only got to start the latter (which is a much easier read).

Reading Wolf’s book as the China led volatility was unfolding only led to an enhanced feeling of negativity from the themes of the book, namely the lessons as yet unlearned from the crisis. Wolf competently covers much of the causes of the crisis and its aftermath – a global savings glut and associated global imbalances, an expansionary monetary policy that ignored asset prices and credit, an unstable liberalized financial system supervised by naïve regulation. The following graph from the IMF reminds of the global imbalances that proved so toxic when combined with a rampant financial sector.

click to enlargeGlobal Current Account Imbalances 1980 to 2013

Wolf questions the “belief that government borrowing is the illness for which private borrowing is the cure has survived all that has happened”. Some of the solutions that Wolf proposes include much higher capital requirements for banks than is currently being implemented under Basel III, deleveraging initiatives such as tax incentives towards equity and away from debt, corporate tax changes to encourage corporate investment, changes in debt contracts to convert to equity on macro-economic metrics, policies to address income inequality and to promote research and education.

A more radical reform of the financial system, along the lines of the Chicago Plan for 100% reserve banking whereby the ability to create money is taken away from profit seeking banks and given solely to central banks, is a step that Wolf favours but believes is unrealistic given the realpolitik of the developed world system. On the globalised financial system, Wolf believes that the “obvious truth that unless regulation and the supply of fiscal backstops is to be much more global, finance should be far less so” and suggests a greater segmentation of the world’s financial system.

There are many themes in Wolf’s book that got me thinking and I am hoping that Mason’s book will do the same, albeit from a totally different perspective. I think the market volatility has more time to play out and hopefully my summer reading, although yet to be completed, will assist in understanding what may come next.

Stressing the scenario testing

Scenario and stress testing by financial regulators has become a common supervisory tool since the financial crisis. The EU, the US and the UK all now regularly stress their banks using detailed adverse scenarios. In a recent presentation, Moody’s Analytics illustrated the variation in some of the metrics in the adverse scenarios used in recent tests by regulators, as per the graphic below of the peak to trough fall in real GDP.

click to enlargeBanking Stress Tests

Many commentators have criticized these tests for their inconsistency and flawed methodology while pointing out the political conflict many regulators with responsibility for financial stability have. They cannot be seen to be promoting a draconian scenario for stress testing on the one hand whilst assuring markets of the stability of the system on the other hand.

The EU tests have particularly had a credibility problem given the political difficulties in really stressing possible scenarios (hello, a Euro break-up?). An article last year by Morris Goldstein stated:

“By refusing to include a rigorous leverage ratio test, by allowing banks to artificially inflate bank capital, by engaging in wholesale monkey business with tax deferred assets, and also by ruling out a deflation scenario, the ECB produced estimates of the aggregate capital shortfall and a country pattern of bank failures that are not believable.”

In a report from the Adam Smith Institute in July, Kevin Dowd (a vocal critic of the regulator’s approach) stated that the Bank of England’s 2014 tests were lacking in credibility and “that the Bank’s risk models are worse than useless because they give false risk comfort”. Dowd points to the US where the annual Comprehensive Capital Assessment and Review (CCAR) tests have been supplemented by the DFAST tests mandated under Dodd Frank (these use a more standard approach to provide relative tests between banks). In the US, the whole process has been turned into a vast and expensive industry with consultants (many of them ex-regulators!) making a fortune on ever increasing compliance requirements. The end result may be that the original objectives have been somewhat lost.

According to a report from a duo of Columba University professors, banks have learned to game the system whereby “outcomes have become more predictable and therefore arguably less informative”. The worry here is that, to ensure a consistent application across the sector, regulators have been captured by their models and are perpetuating group think by dictating “good” and “bad” business models. Whatever about the dangers of the free market dictating optimal business models (and Lord knows there’s plenty of evidence on that subject!!), relying on regulators to do so is, well, scary.

To my way of thinking, the underlying issue here results from the systemic “too big to fail” nature of many regulated firms. Capitalism is (supposedly!) based upon punishing imprudent risk taking through the threat of bankruptcy and therefore we should be encouraging a diverse range of business models with sensible sizes that don’t, individually or in clusters, threaten financial stability.

On the merits of using stress testing for banks, Dowd quipped that “it is surely better to have no radar at all than a blind one that no-one can rely upon” and concluded that the Bank of England should, rather harshly in my view, scrap the whole process. Although I agree with many of the criticisms, I think the process does have merit. To be fair, many regulators understand the limitations of the approach. Recently Deputy Governor Jon Cunliffe of the Bank of England admitted the fragilities of some of their testing and stated that “a development of this approach would be to use stress testing more counter-cyclically”.

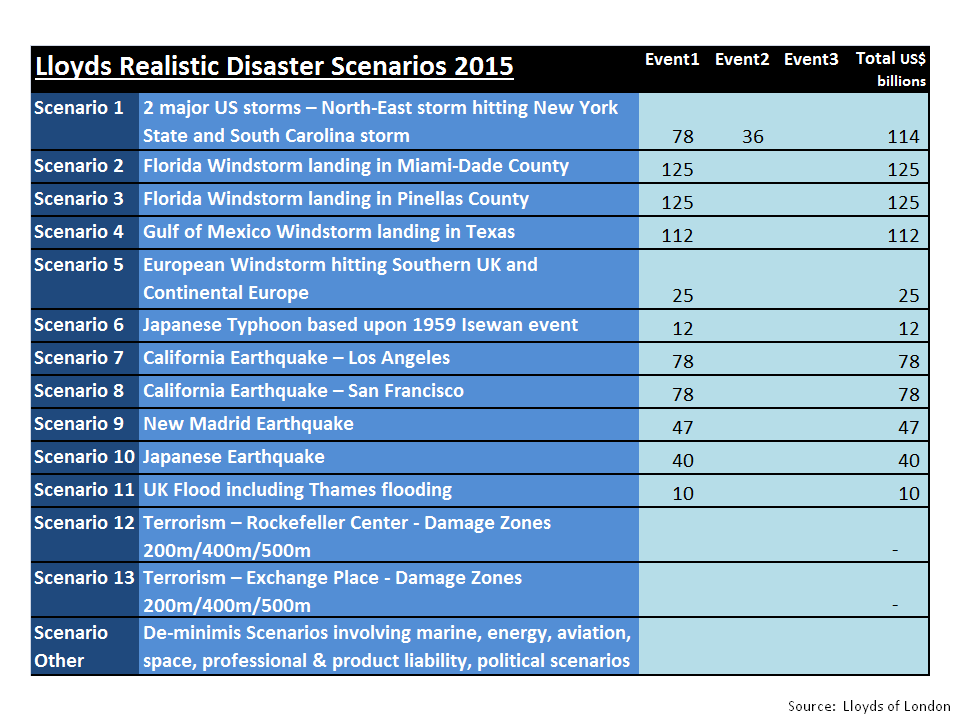
The insurance sector, particularly the non-life sector, has a longer history with stress and scenario testing. Lloyds of London has long required its syndicates to run mandatory realistic disaster scenarios (RDS), primarily focussed on known natural and man-made events. The most recent RDS are set out in the exhibit below.

click to enlargeLloyds Realistic Disaster Scenarios 2015

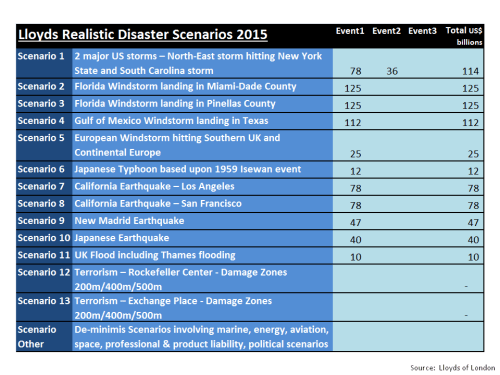
A valid criticism of the RDS approach is that insurers know what to expect and are therefore able to game the system. Risk models such as the commercial catastrophe models sold by firms like RMS and AIR have proven ever adapt at running historical or theoretical scenarios through today’s modern exposures to get estimates of losses to insurers. The difficulty comes in assigning probabilities to known natural events where the historical data is only really reliable for the past 100 years or so and where man-made events in the modern world, such as terrorism or cyber risks, are virtually impossible to predict. I previously highlighted some of the concerns on the methodology used in many models (e.g. on correlation here and VaR here) used to assess insurance capital which have now been embedded into the new European regulatory framework Solvency II, calibrated at a 1-in-200 year level.

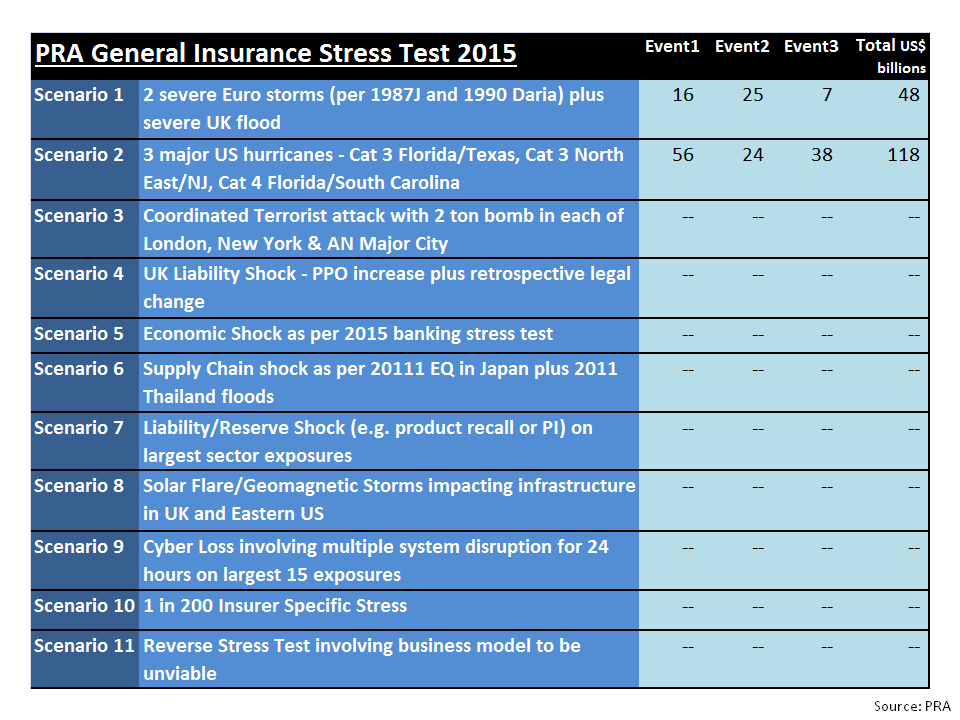
The Prudential Regulatory Authority (PRA), now part of the Bank of England, detailed a set of scenarios last month to stress test its non-life insurance sector in 2015. The detail of these tests is summarised in the exhibit below.

click to enlargePRA General Insurance Stress Test 2015

Robert Childs, the chairman of the Hiscox group, raised some eye brows by saying the PRA tests did not go far enough and called for a war game type exercise to see “how a serious catastrophe may play out”. Childs proposed that such an exercise would mean that regulators would have the confidence in industry to get on with dealing with the aftermath of any such catastrophe without undue fussing from the authorities.

An efficient insurance sector is important to economic growth and development by facilitating trade and commerce through risk mitigation and dispersion, thereby allowing firms to more effectively allocate capital to productive means. Too much “fussing” by regulators through overly conservative capital requirements, maybe resulting from overtly pessimistic stress tests, can result in economic growth being impinged by excess cost. However, given the movement globally towards larger insurers, which in my view will accelerate under Solvency II given its unrestricted credit for diversification, the regulator’s focus on financial stability and the experiences in banking mean that fussy regulation will be in vogue for some time to come.

The scenarios selected by the PRA are interesting in that the focus for known natural catastrophes is on a frequency of large events as opposed to an emphasis on severity in the Lloyds’ RDS. It’s arguable that the probability of the 2 major European storms in one year or 3 US storms in one year is significantly more remote than the 1 in 200 probability level at which capital is set under Solvency II. One of the more interesting scenarios is the reverse stress test such that the firm becomes unviable. I am sure many firms will select a combination of events with an implied probability of all occurring with one year so remote as to be impossible. Or select some ultra extreme events such as the Cumbre Vieja mega-tsunami (as per this post). A lack of imagination in looking at different scenarios would be a pity as good risk management should be open to really testing portfolios rather than running through the same old known events.

New scenarios are constantly being suggested by researchers. Swiss Re recently published a paper on a reoccurrence of the New Madrid cluster of earthquakes of 1811/1812 which they estimated could result in $300 billion of losses of which 50% would be insured (breakdown as per the exhibit below). Swiss Re estimates the probability of such an event at 1 in 500 years or roughly a 10% chance of occurrence within the next 50 years.

click to enlarge1811 New Madrid Earthquakes repeated

Another interesting scenario, developed by the University of Cambridge and Lloyds, which is technologically possible, is a cyber attack on the US power grid (in this report). There have been a growing number of cases of hacking into power grids in the US and Europe which make this scenario ever more real. The authors estimate the event at a 1 in 200 year probability and detail three scenarios (S1, S2, and the extreme X1) with insured losses ranging from $20 billion to $70 billion, as per the exhibit below. These figures are far greater than the probable maximum loss (PML) estimated for the sector by a March UK industry report (as per this post).

click to enlargeCyber Blackout Scenario

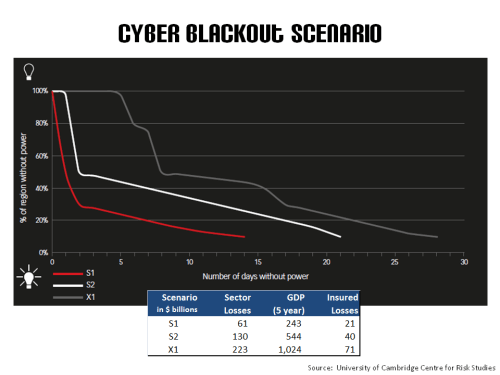
I think it will be a very long time before any insurer willingly publishes the results of scenarios that could cause it to be in financial difficulty. I may be naive but I think that is a pity because insurance is a risk business and increased transparency could only lead to more efficient capital allocations across the sector. Everybody claiming that they can survive any foreseeable event up to a notional probability of occurrence (such as 1 in 200 years) can only lead to misplaced solace. History shows us that, in the real world, risk has a habit of surprising, and not in a good way. Imaginative stress and scenario testing, performed in an efficient and transparent way, may help to lessen the surprise. Nothing however can change the fact that the “unknown unknowns” will always remain.