Tag Archives: Willis Re

London Isn’t Calling

In a previous post, I reproduced an exhibit from a report from Aon Benfield on the potential areas of disruption to extract expenses across the value chain in the non-life insurance sector, specifically the US P&C sector. The exhibit is again reproduced below.

 click to enlargeexpenses-across-the-value-chain

The diminishing returns in the reinsurance and specialty insurance sector are well known due to too much capital chasing low risk premia. Another recent report from Aon Benfield shows the sector trend in net income ROE from their market representative portfolio of reinsurance and specialty insurers, as below.

click to enlargenet-income-roe

It’s odd then in this competitive environment that the expense ratios in the sector are actually increasing. Expense ratios (weighted average) from the Willis Re sector representative portfolio, as below and in this report, illustrate the point.

click to enlargewillis-re-expense-ratios

The 2016 edition of the every interesting S&P Reinsurance Highlights, as per this link, also shows a similar trend in expense ratios as well as showing the variance in ratios across different firms, as below.

click to enlargesp-expense-ratios

Care does need to be taken in comparing expense ratios as different expense items can be included in the ratios, some limit overhead expenses to underwriting whilst others include a variety of corporate expense items. One thing is clear however and that’s that firms based in the London market, particularly Lloyds’, are amongst the most top heavy in the industry. Albeit a limited sample, the graph below shows the extent of the difference of Lloyds’ and some of its peers in Bermuda and Europe.

click to enlargeselect-expense-ratios

Digging further into expense ratios leads naturally to acquisitions costs such as commission and brokerage. Acquisition costs vary across business lines and between reinsurance and insurance so business mix is important. The graph below on acquisition costs again shows Lloyds’ higher than some of its peers.

click to enlargeselect-acquisition-cost-ratios

Although Brexit may only result in the loss of fewer than 10% of London’s business, any loss of diversification in this competitive market can impact the relevance of London as an important marketplace. Taken together with the gratuitous expense of doing business in London, its relevance may come under real pressure in the years to come. London is, most definitely, not calling.

Naive Newcomers

The insurance sector has been hit by the Brexit fallout on worries about macro-economic impacts; albeit not to the same extend as the banks. Swiss Re has their latest Sigma world insurance report out. The impact of investment returns on the life insurance sector is obvious but it is interesting to see the contribution from investment income on the profitability of the aggregate of the eight largest markets in the non-life insurance sector, as per the graph from the report below.

click to enlargeNonLife Insurance Sector Profit Breakdown

The insurance sector faces a number of challenges as a recent FT article pointed out. The reinsurance sector also faces challenges, not least of which is a competitive pricing environment and the destabilising influx of new yield seeking capital through new innovations in the insurance linked securities (ILS) market. I have posted my views on the ILS sector many times (more recently here) and in this post I offer more similar thoughts. It is interesting to compare the ROEs in the Sigma report from the non-life insurance sector against those from the reinsurance sector (with the ROEs since 2005 coming from the Guy Carpenter composite index), as per the graph below.

click to enlargeGlobal Insurance & Reinsurance ROEs 1999 to 2016e

The graph is not exactly comparing like with like (e.g. non-life insurance versus composite reinsurance) but it gives the general idea of higher but more volatile ROEs in the reinsurance side compared to more stable but lower ROEs on the direct insurance side. The average since 1999 for insurance is 7% and 9% for reinsurance, with standard deviations of 3.6% and 4.6% respectively. It also confirms that ROEs are under pressure for both sectors and as capital markets continue to siphon off volatile excess catastrophe exposed business, the ROEs of the more proportional traditional reinsurance sector are converging on those of their direct brethren, although a differential will always exist given the differing business models.

It is important to note that these ROEs are returns on equity held by traditional insurers and reinsurers, the majority of which are highly rated by external agencies, who hold a small fraction of their total exposure (if measured as the sum of the policy limits issued) as capital. For example, the new European solvency framework, Solvency II, requires capital at a 1 in 200 level and it is generally assumed to be akin to a financial strength rating of BB or BBB, depending upon a firm’s risk profile.

As I argued previously (more recently in this post), these (re)insurers are akin to fractional reserve banks and I still struggle to understand how ILS structures, which are 100% collaterised, can offer their investors such an attractive return given their fully funded “capital” level in the ROE calculation. The industry argument is that investors have a lower cost of capital due to the uncorrelated nature of the pure insurance risk present in ILS.

My suspicion is that the lower cost of capital assigned by investors is reflective of a lack of understanding of the uncertainties surrounding the risks they are taking on and an over-reliance on modelling which does not fully consider the uncertainties. My fear is that capital is been leveraged or risks are been arbitraged through over-generous retrocession deals passing on under-priced risk to naive capital newcomers.

The accelerating growth in the so-called alternative capital in insurance is shown in the graph below from Aon Benfield, with growth in the private collaterised reinsurance being particularly strong in the last four years (now overshadowing the public CAT bond market). ILS funds, managed by professional asset manager specialists, are largely behind the growth in private collaterised deals with assets under management growing from $20 billion in 2012 to over $50 billion today. Private collaterised deals are usually lower down the reinsurance tower (e.g. attach at lower loss levels) and as such offer higher premiums (as a percentage of limits, aka rate on line or ROL) for the increased exposure to loss. On a risk adjusted basis, these don’t necessarily offer higher ROEs than higher attaching/lower risk CAT bonds.

click to enlargeAlternative Insurance ILS Capital Growth

Property catastrophe pricing has been under particular pressure in the past few years due to the lack of significant insured catastrophe losses. In a previous post, I crudely estimate CAT pricing to be 25% below its technical rate. Willis Re is the first of the brokers to have its mid-year renewal report out. In it, Willis said that ILS funds “were more aggressive on pricing during the second quarter as spreads declined for liquid reinsurance investments”. I also find it interesting that the collaterised ILW volumes have ticked up recently. Pricing and lax terms and conditions in the retrocession sector are historically a sign that discipline is breaking down. Asset managers in the ILS space must be under pressure in maintaining their high fees in a reduced CAT risk premia environment and this pressure is likely to be contributing to the potential for market indiscipline.

I therefore find the graph below very telling. I used the figures from Lane Financial (see here) for the annual total return figures from CAT bonds, which closely match those of the Swiss Re Total Return Index. For the ILS fund returns I used the figures from the Eurekahedge ILS Advisors Index which I adjusted to take out the not unconsiderable typical ILS fund management fees. The 2016 figures are annualized based upon published year to date figures (and obviously assume no major losses).

click to enlargeCAT Bond vrs ILS Fund Returns

The graph shows that ILS fund returns have broken with historical patterns and diverged away from those of CAT bonds as the prevalence in private collaterised deals has grown in recent years. In other words, ILS funds have moved to higher rate on line business, which is by definition higher risk, as they push to service the larger level of assets under management. The question is therefore do the investors really understand the significance of this change? Have they adjusted their cost of capital to reflect the increased risk? Or are some ILS funds representing the higher returns as their ability to get higher returns at the same risk level (against the trend of everybody else in the industry in a softening market)?

Innovation is to be encouraged and a necessary part of progress. Innovation dependent on the naivety of new investors however does not end well.

I can’t but help think of Michael Wade’s comment in 2009 about the commonality between the financial crisis and problems at Lloyds of London (see this post on lessons from Lloyds) when he said that “the consequence with the excess capital was that underlying risks could be underpriced as they were being passed on”. My advice to ILS investors is the next time they are getting a sales pitch with promises of returns that sound too good, look around the room, and ask yourself who is the greater fool here….

Arthur opens the US Hurricane Season

After Hurricane Arthur briefly made landfall in North Carolina on Thursday night, a weakened storm is now heading north. I thought this would be good time to have a look at the probable maximum losses (PMLs) published as at the Q1 2014 results by a sample of specialist (re)insurers, first presented in a post in June 2013. That post went into some detail on the uncertainties surrounding the published PMLs and should be read as relevant background to the figures presented here.

Despite predictions of an above average 2013 Atlantic hurricane season, the number of named hurricanes was the lowest since 1982. Predictions for the 2014 season are for a below average number of hurricanes primarily due to cooler sea temperatures in the Atlantic due to the transition to El Niño (although that is now thought to be slower than previously anticipated). The graph below includes the 2014 predictions.
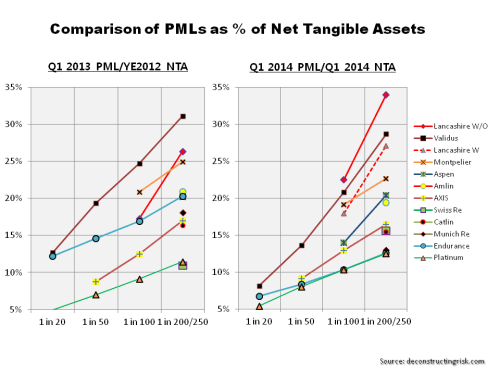
click to enlargeHistorical Atlantic Storms & Hurricanes I like to look at PMLs as a percentage of net tangible assets (NTA) on a consistent basis across firms to assess exposures from a common equity viewpoint. Many firms include subordinated debt or other forms of hybrid debt in capital when showing their PMLS. For example, Lancashire has approximately $330 million of sub-debt which they include in their capital figures and I have show the difference with and without the sub-debt in the percentages for Lancashire in the graph below on US wind PMLs to illustrate the comparison.

Whether hybrid debt comes in before equity or alongside equity depends upon the exact terms and conditions. The detail of such instruments will determine whether such debt is classified as tier 1, 2 or 3 capital for regulatory purposes under Solvency II (although there are generous transitional timeframes of up to 10 years for existing instruments). The devil is often in the detail and that is another reason why I prefer to exclude them and use a consistent NTA basis.

As per the June 2013 post, firms often classify their US wind exposures by zone but I have taken the highest exposures for each (which may not necessarily be the same zone for each firm).

click to enlargeUS Wind PMLs Q1 2014 
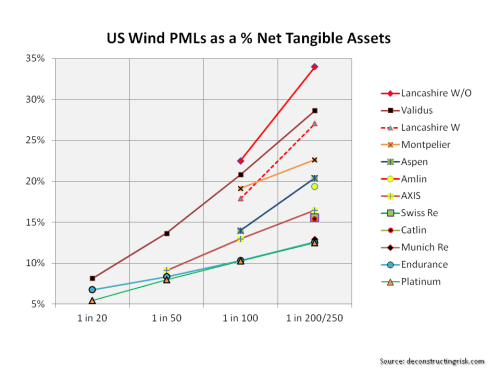
These exposures, although expressed as percentages of NTAs, should be considered net of potential profits made for 2014 to assess the real impact upon equity (provided, of course, that the expected profits don’t all come from property catastrophe lines!). If for example we assume a 10% return on NTA across each firm, then the figures above have to be adjusted.

Another issue, also discussed in the previous post, is the return period for similar events that each firms present. For example, the London market firms present Lloyds’ realistic disaster scenarios (RDS) as their PMLs. One such RDS is a repeat of the 1926 Miami hurricane which is predicted to cost $125 billion for the industry if it happened today. For the graph above, I have assumed a 1 in 200 return period for this scenario. The US & Bermudian firms do not present scenarios but points on their occurrence exceedance probability (OEP) curves.

As it is always earthquake season, I also include the PMLs for a California earthquake as per the graph below.

click to enlargeCalifornia EQ PMLs Q1 2014 
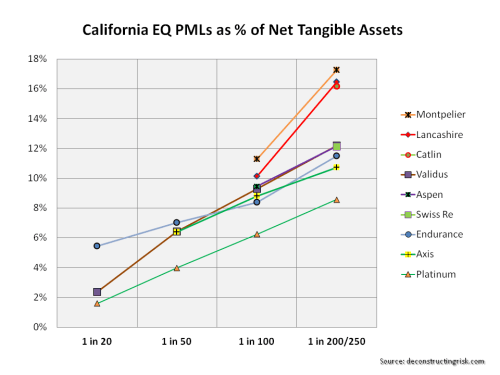
In terms of current market conditions, the mid-year broker reports are boringly predictable. John Cavanagh, the CEO of Willis Re, commented in their report that “the tentacles of the softening market are spreading far and wide, with no immediate signs of relief. We’ve seen muted demand throughout 2014 and market dynamics are unlikely to change for some time to come. The current market position is increasingly challenging for reinsurers.” Aon Benfield, in their report, stated that “the lowest reinsurance risk margins in a generation stimulate new growth opportunities for insurers and may allow governments to reduce their participation in catastrophe exposed regions as insurance availability and affordability improves”. When people start talking about low pricing leading to new opportunities to take risk, I can but smile. That’s what they said during the last soft market, and the one before that!

Some commentators are making much of the recent withdrawal of the latest Munich Re bond on pricing concerns as an indicator that property catastrophe prices have reached a floor and that the market is reasserting discipline. That may be so but reaching a floor below the technical loss cost level sounds hollow to me when talking about underwriting discipline.

To finish, I have reproducing the graph on Flagstone Re from the June 2013 post as it speaks a thousand words about the dangers of relying too much on the published PMLs. Published PMLs are, after all, only indicators of losses from single events and, by their nature, reflect current (group) thinking from widely used risk management tools.

click to enlargeFlagstone CAT losses Follow-on: It occurred to me after posting that I could compare the PMLs for the selected firms as at Q1 2014 against those from Q1 2013 and the graph below shows the comparison. It does indicate that many firms have taken advantage of cheap reinsurance/retrocession and reduced their net profiles, as highlighted in this post on arbitrage opportunities. Some firms have gone through mergers or business model changes. Endurance, for example, has been changed radically by John Charman (as well as being an aggressive buyer of coverage). Lancashire is one of the only firms whose risk profile has increased using the NTA metric as a result of the Cathedral acquisition and the increase in goodwill.

click to enlargeUS Wind PMLs Q1 2013 vrs 2014

Does financial innovation always end in reduced risk premia?

Quarterly reports from Willis Re and Aon Benfield highlight the impact on US catastrophe pricing from the new capital flowing into the insurance sector through insurance linked securities (ILS) and collaterised covers. Aon Benfield stated that “clients renewing significant capacity in the ILS market saw their risk adjusted pricing decrease by 25 to 70 percent for peak U.S. hurricane and earthquake exposed transactions” and that “if the financial management of severe catastrophe outcomes can be attained at multiple year terms well inside the cost of equity capital, then at the extreme, primary property growth in active zones could resume for companies previously restricting supply”.

This represents a worrying shift in the sector. Previously, ILS capacity was provided at rates at least equal to and often higher than that offered by the traditional market. The rationale for a higher price made sense as the cover provided was fully collaterized and offered insurers large slices of non-concentrated capacity on higher layers in their reinsurance programmes. The source of the shift is significant new capacity being provided by yield seeking investors lured in by uncorrelated returns. The Economist’s Buttonwood had an article recently entitled “Desperately seeking yield” highlighting that spreads on US investment grade corporate bonds have halved in the past 5 years to about 300bps currently. Buttonwood’s article included Bill Gross’s comment that “corporate credit and high-yield bonds are somewhat exuberantly and irrationally priced”. As a result, money managers are searching for asset classes with higher yields and, by magic, ILS offers a non-correlating asset class with superior yield.  Returns as per those from Eurekahedge on the artemis.bm website in the exhibit below highlight the attraction.

ILS Returns EurekahedgeSuch returns have been achieved on a limited capacity base with rationale CAT risk pricing. The influx of new capital means a larger base, now estimated at $35 billion of capacity up from approximately $5 billion in 2005, which is contributing to the downward risk pricing pressures under way. The impact is particularly been felt in US CAT risks as these are the exposures offering the highest rate on lines (ROL) globally and essential risks for any new ILS fund to own if returns in excess of 500 bps are to be achieved. The short term beneficiaries of the new capacity are firms like Citizens and Allstate who are getting collaterised cover at a reduced risk premium.

The irony in this situation is that these same money managers have in recent years shunned traditional wholesale insurers, including professional CAT focussed firms such as Montpelier Re, which traded at or below tangible book value. The increase in ILS capacity and the resulting reduction of risk premia will have a destabilising impact upon the risk diversification and therefore the risk profile of traditional insurers. Money managers, particularly pension funds, may have to pay for this new higher yielding uncorrelated asset class by taking a hit on their insurance equities down the road!

Financial innovation, yet again, may not result in an increase in the size of the pie, as originally envisaged, but rather mean more people chasing a smaller “mispriced” pie. Sound familiar? When thinking of the vast under-pricing of risk that the theoretical maths driven securitisation innovations led to in the mortgage market, the wise words of the Buffet come to mind – “If you have bad mortgages….they do not become better by repackaging them”. Hopefully the insurance sector will avoid those mistakes!