Category Archives: Economics

Crimping CDS

The post-crisis CDS market has undergone significant regulatory change including a substantial regulatory overhaul due to the Volcker Rule, requirements from reporting to central clearing under the Dodd–Frank Act and the European Markets Infrastructure Regulation (EMIR), and Basel III capital and liquidity regulations. Measuring the size of the market consistently is notorious difficult given different accounting treatments, netting protocols, collateral requirements, and legal enforceability standards. Many organisations have been publishing data on the market (my source is the BIS for this post) but consistency has been an issue. Although a deeply flawed metric (due to some of the reasons just highlighted and then some), the graph below on the nominal size of the CDS market (which updates this post) illustrates the point on recent trends.

click to enlarge

The gross market value (defined by BIS as the sum of the absolute values of all open contracts with either positive or negative replacement values) and the net market value (which includes counterparty netting) are better metrics and indicate the real CDS exposure is a small fraction of the nominal market size, as per the graph below.

click to enlarge

Critics of the regulatory impact on the liquidity of the CDS market argue that these instruments are a vital tool in the credit markets for hedging positions, allowing investors to efficiently express investment positions and facilitating price discovery. A major issue for liquidity in the market is the capital constraints imposed by regulators which impedes the ability of financial institutions to engage in market-making. The withdrawal of Deutsche Bank from the CDS market was seen as a major blow despite some asset managers and hedge funds stepping up to the mark.

The impact of rising interest rates in the coming years on the credit markets will likely have some interesting, and potentially unforeseen, consequences. With a plethora of Goldman Sachs alumni currently working on Trump’s “very major hair cut on Dodd-Frank”, amongst other regulations, it will be interesting to see if any amendments lead to a shot in the arm for the CDS market. Jamie Dimon, in his most recent shareholder letter, calls for an approach by Trumps’ lieutenants “to open up the rulebook in the light of day and rework the rules and regulations that don’t work well or are unnecessary”.


June 2020 Update – Below is the CD graph updated to the end of 2019. For Ingrid.

Age of Change

As if we all needed proof that the people across the so called developed world are troubled about the future, the election of Donald Trump to the US presidency last Tuesday is still a shock and unfolded in a spookingly familiar manner to the Brexit vote. “Wrong!” as Alec Baldwin has so aptly mimicked could be the call to the pollsters and commentators who are now scratching around despondently for reasons.

Why, we again ask, could an electorate so recklessly vote against conventional wisdom. I think the answer is in the question. Although the factors behind Trump’s vote are multi-faceted and reflect a bizarre coalition that will be impossible to satisfy, the over-riding factor has to lie at the door of an electorate that is troubled by future prospects and rejects the status quo. Why else would they vote for a man that polls suggests a majority acknowledge as been unqualified for the job? Aspects such as the worry of aging baby boomers at the diminishing returns on savings, the insecurity of the middle and working classes over globalisation, and the realisation that the technology from the shared economy is a cover for unsecure low wage employment have all contributed. Like in the Brexit vote, Trump tapped into a nostalgia for times past as an easy answer to the complex questions facing the world we live in.

The age profile of the Brexiteers in the UK and Trump voters in the US is interesting in that it highlights that Trump’s surprise victory is slightly less of a factor of age than Brexit.

click to enlargetrump-brexit-vote-by-age

Aging demographics in the developed world has been highlighted by many as a contributor to the current low growth. I last posted on this topic before here and the graph below is a reminder of one of the current predictions by the UN.

click to enlargeunited-nations-population-projections-2015-to-2100

The impacts of aging on future dependency ratios can be seen below, again from UN predictions.

click to enlargeglobal-dependency-ratios

A fascinating report from the research department of the FED last month, entitled “Understanding the New Normal: The Role of Demographics”, argues that demographic factors alone in the US account for 1.25% decline in the nature rate of interest and real GDP growth since 1980. The report concludes that “looking forward, the model suggests that low interest rates, low output growth, and low investment rates are here to stay, suggesting that the U.S. economy has entered a new normal”.

There was an interesting article recently in the FT called “The effects of aging” which included the graph below from UBS which strikingly highlights the changes in demographic trends and financial crises.

click to enlargefinancial-crisis-demographic-turning-points

Whatever disparate concoction of economic policies that Trump will follow in an attempt to tap the ghost of Reaganomics, it is clear that lower taxes and increased US debt will be feature. Trump may surprise everyone and use debt wisely to increase productivity on items such as rebuilding infrastructure, although it’s more likely to go on wasteful expenditure to satisfy his motley crew of constituents (eh hello, a Mexico wall!).

I constructed an index to show the relative level of debt dependency of countries using the 2020 debt level predicted by the IMF and the average 2020 to 2050 dependency ratios by the UN. Both the US and the UK are above the average based upon current forecasts and really can’t afford any debt laden policy cul-de-sacs. One only has to look at Japan for enlightenment in that direction. We have to hope that policies pursued by politicians in the US and the UK in their attempt to bring back the past over the next few years don’t result in unsustainable debt levels. Maybe inflation, some are calling the outcome of Trump’s likely policies trumpflation, will inflate debts away!

click to enlargedebt-dependency-index

In his recent book, “A banquet of consequences”, Satyajit Das articulated the choice we have in terms of a choice of two bad options by using the metaphor of the ancient  mythical sea monsters, Scylla and Charybdis, who terrorised sailors. Das said “Today, the world is trapped between Scylla, existing policies that promise stagnation and slow decline, and Charybdis, decisive action that leads to an immediate loss in living standards.

The character of Charybdis is said to be the personification of a whirlwind. Remind you of anyone….?

One Direction

Goldman Sachs says “we have more potential for shocks right now”. Deutsche Bank and Bank of America Merrill Lynch predict a pick-up in volatility to hit equities. The ever positive Albert Edwards of Socgen points to a recent IMF report on debt and trashes the Fed with the quip “these dudes will never identify an asset bubble at least before the event!

In the IMF report referenced above, and other reports published by the IMF this month, there is some interesting analysis and a sample of the accompanying graphs are reproduced below.

All of these graphs show trends going inexorably in one direction. Add in dollops of (not unrelated) political risk particularly in the UK and across Europe, and that direction looks like trouble ahead.

click to enlargeimf-gross-global-debt-as-of-gdp

click to enlargeimf-private-debt-during-deleveraging-periods

click to enlargeimf-decomposition-of-equity-valuations-october-2016

click to enlargeimf-global-real-rates

click to enlargeimf-report-sovereign-bond-yields-and-term-premiums

click to enlargeimf-report-banking-sector

click to enlargeimf-report-pension-deficits

Restrict the Renters?

It is no surprise that the populist revolt against globalisation in many developed countries is causing concern amongst the so called elite. The philosophy of the Economist magazine is based upon its founder’s opposition to the protectionist Corn Laws in 1843. It is therefore predictable that they would mount a strong argument for the benefits of free trade in their latest addition, citing multiple research sources. The Economist concludes that “a three pronged agenda of demand management, active labour-market policies and boosting competition would go a long way to tackling the problems that are unfairly laid at the door of globalisation”.

One of the studies referenced in the Economist articles which catch my eye is that by Jason Furman of the Council of Economic Advisors in the US. The graph below from Furman’s report shows the growth in return on invested capital (excluding goodwill)  of US publically quoted firms and the stunning divergence of those in the top 75th and 90th percentiles.

click to enlargereturn-on-invested-capital-us-nonfinancial-public-firms

These top firms, primarily in the technology sector, have increased their return on invested capital (ROIC) from 3 times the median in the 1990s to 8 times today, dramatically demonstrating their ability to generate economic rent in the digitized world we now live in.

Furman’s report includes the following paragraph:

“Traditionally, price fixing and collusion could be detected in the communications between businesses. The task of detecting undesirable price behaviour becomes more difficult with the use of increasingly complex algorithms for setting prices. This type of algorithmic price setting can lead to undesirable price behaviour, sometimes even unintentionally. The use of advanced machine learning algorithms to set prices and adapt product functionality would further increase opacity. Competition policy in the digital age brings with it new challenges for policymakers.”

IT firms have the highest operating margins of any sector in the S&P500, as can be seen below.

click to enlargesp-500-operating-profit-margins-by-sector

And the increasing size of these technology firms have contributed materially to the increase in the overall operating margin of the S&P500, as can also be seen below. These expanding margins are a big factor in the rise of the equity market since 2009.

click to enlargesp-500-historical-operating-profit-margins

It is somewhat ironic that one of the actions which may be needed to show the benefits of free trade and globalisation to citizens in the developed world is coherent policies to restrict the power of economic rent generating technology giants so prevalent in our world today…

Pimping the Peers (Part 2)

In the last post on this topic, I highlighted how new technologies, broadly under the fintech tag, had the potential to disrupt the banking sector, primarily by means of automating processes rather than any major reinventing of business models (although I did end that post with a bit of a rant about innovation and human behaviour). Blockchain is the hot topic that seems to be cropping up everywhere (I’ll leave that for another time). This post is about insurance and new technology, or in the jargon, insurtech.

The traditional business model in the insurance industry is not reacting well to a world of low or negative interest rates. For the life insurance sector, the duration mismatch between their liabilities and their assets is having a perverse impact as interest rates have fallen. Savings returns for aging populations have been sacrificed in Central Bank’s attempt to stimulate economic growth.

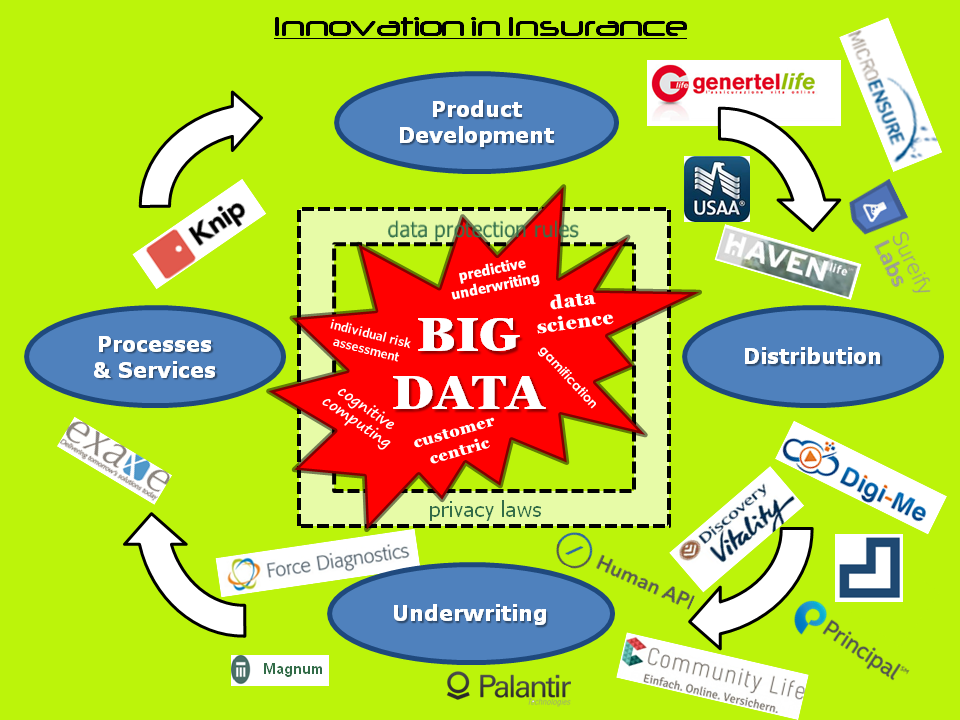
In addition, the traditional distribution channel for selling life insurer’s products, and the old adage is that these products are sold rather than bought, has relied too heavily on aging tied agents whose focus is on the wealthy client that can generate more fees than the middle class. The industry is generally at a loss on how to sell products in a low interest world to the mass market and to the new tech savvy generation. As a result, the industry and others are throwing money at a rash of new start-ups in insurance, as the exhibit on some of the current hyped firms focusing on life insurance below illustrates.

click to enlargelife-insurance-big-data

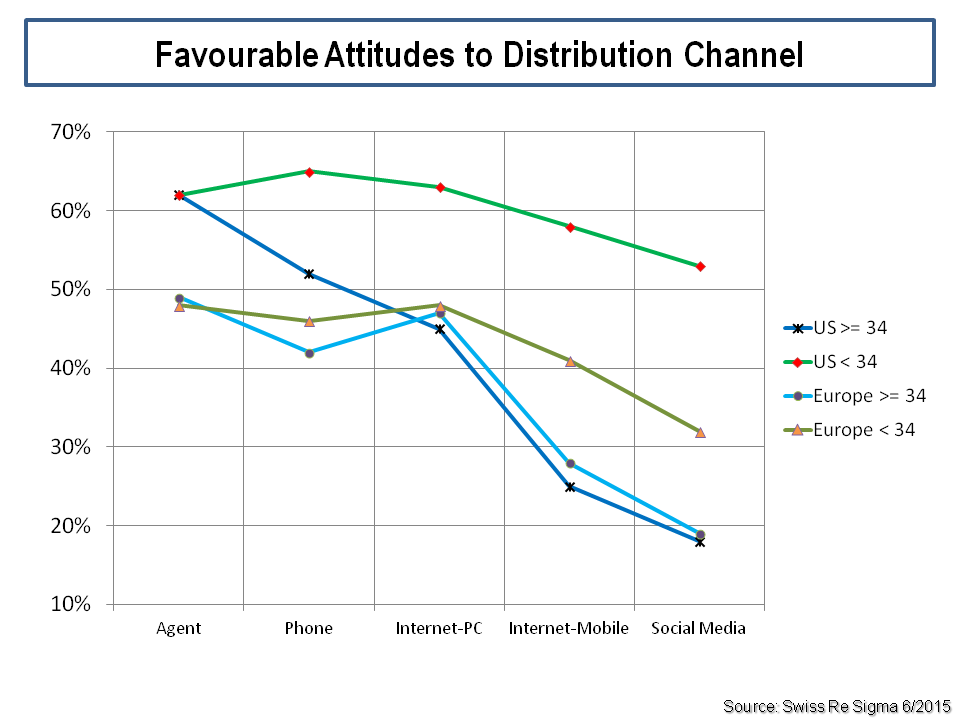
As the exhibit illustrates, the focus of these new start-ups is weighted towards technologies around product development, distribution, and underwriting. Some will likely succeed in trying to differentiate further the existing clientele of life insurers (e.g. real time health data). Many will be gobbled up or disappear. Differing attitudes between those aged under 34 and the older generation towards online distribution channels can be clearly seen in the survey results in the exhibit below.

click to enlargeattitudes-to-life-insurance-distribution-channels

With longevity and low interest rates the dominant challenges for life insurers today, automation of processes will assist in cutting expenses in the provision of products (mainly to the existing customer base) but will not likely meaningfully address the twin elephants in the room.  Citigroup reckons that in 20 of the largest OECD countries the unfunded government liability for pensions is around $78 trillion which compares to approximately $50 trillion in GDP for all OECD countries in 2015. I look forward to conversing with a robo-advisor in the near future on what products it recommends for that problem!

Insurance itself is hundreds of years old and although the wonderfully namely bottomry (the earliest form of marine hull insurance) or ancient burial societies are early examples, non-life insurance really took off with mass markets after the great fire of London in 1666.

The most hyped example of insurtech in the non-life sector is the impact of technologies on the motor business like drive-less cars and car telematics. This paper from Swiss Re shows that the impact over the next 20 years of such advances on motor premia could be dramatic.

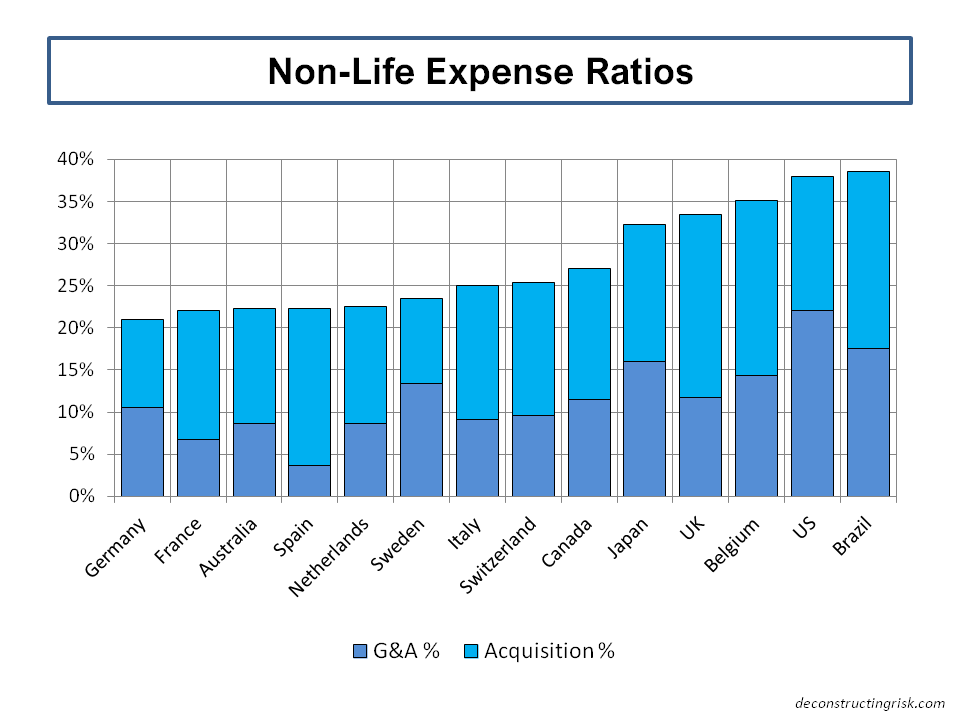
Much of the focus from insurtech innovation is on reducing expenses, an item that the industry is not light on. The graph below shows examples of the level of acquisition and overhead expenses in the non-life sector across different jurisdictions.

click to enlargenonlife-expense-ratios

A recent report from Aon Benfield went further and looked at expenses across the value chain in the US P&C insurance sector, as below. Aon Benfield estimated overall expenses make up approximately half of gross risk premium, much of which represents juicy disruption targets for new technology in the insurtech world.

click to enlargeexpenses-across-the-value-chain

Insurance itself is based upon the law of large numbers and serves a socially useful function in reducing economic volatility by transferring risks from businesses and consumers. In 1906, Alfred Manes defined insurance as “an economic institution resting on the principle of mutuality, established for the purpose of supplying a fund, the need for which arises from a chance occurrence whose probability can be estimated”.

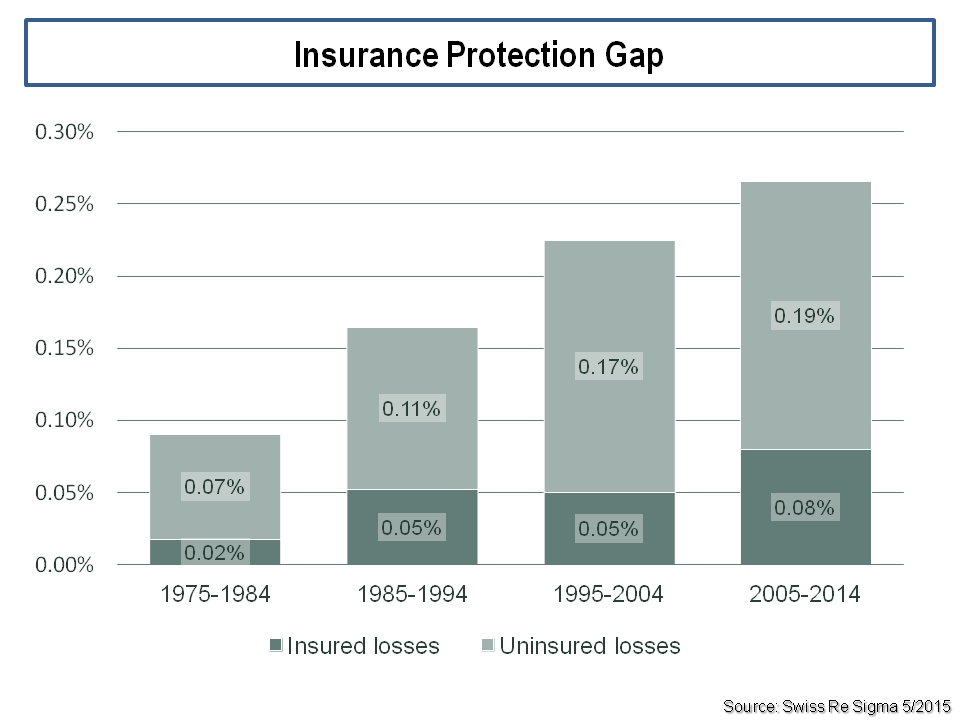
One of the issues identified with the current non-life insurance sector is the so-called protection gap. This is in effect where insurers’ risk management practises have got incredibly adapt at identifying and excluding those risks most likely to result in a claim. Although good for profits, it does bring the social usefulness of the transference of only the pristine risks into question (for everybody else). The graph below from Swiss Re illustrates the point by showing economic and insured losses from natural catastrophe events as a % of GDP.

click to enlargeinsurance-protection-gap-uninsured-vrs-insured-losses

It’s in the context of low investment returns and competitive underwriting markets (in themselves being driven by low risk premia across asset classes) that a new technology driven approach to the mutual insurance model is being used to attack expense and protection gap issues.

Mutuals represent the original business model for many insurers (back to burial schemes and the great fire of 1666) and still represent approximately a third of the sector in the US and Europe today. Peer to peer insurers are what some are calling the new technology driven mutuals. In fact, most of the successful P2P models to date, firms like Guevara, Friendsurance, and Inspeer are really intermediaries who pool consumers together for group discounts or self-financing of high deductibles.

Lemonade, which launched in New York this week, is a peer to peer platform which issues its own insurance policies and seeks to address the protection gap issue by offering broader coverage. The firm has been heavily reinsured by some big names in insurance like Berkshire Hathaway and Lloyd’s. It offers a fee based model, whereby the policyholders pay claims through mutualisation (assumingly by pools determined by pre-defined criteria). Daniel Schreiber, CEO and co-founder of Lemonade says that the firm will be ”the only insurer that doesn’t make money by denying claims”. Dan Ariely, a big deal in the world of Behavioral Economics, has been named as Chief Behavioral Officer, presumably in an effort to assist in constructing pools of well behaved policyholders.

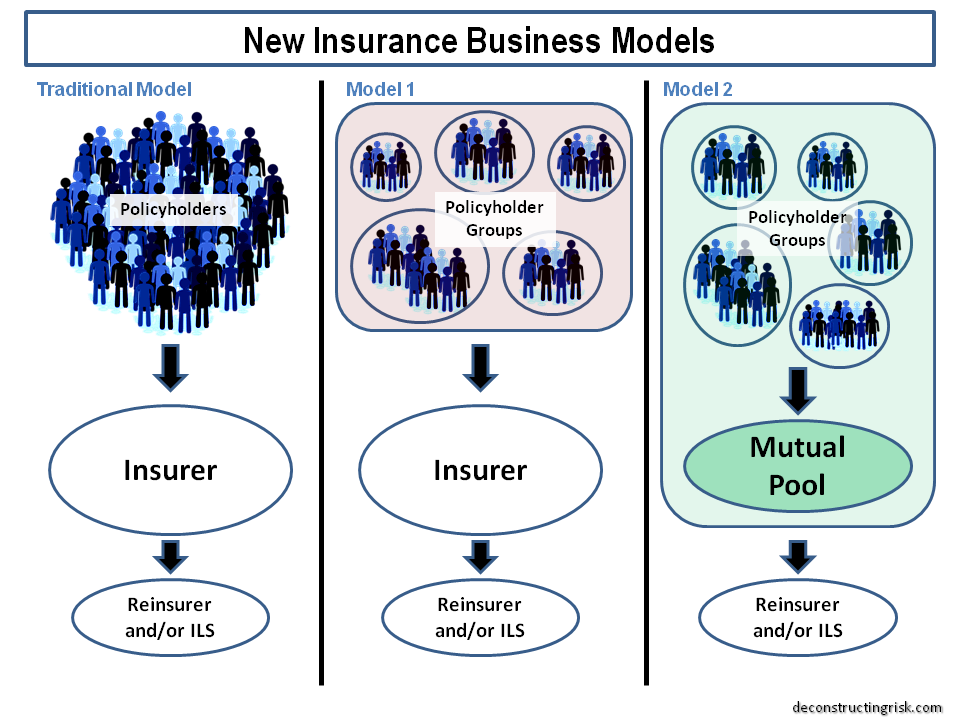
The graphic below tries to illustrate how the business model is evolving (or should that be repeating?). Technology offers policyholders the opportunity to join with others to pool risk, hitherto a process that was confined to associations amongst professional groups or groups bound by location. Whether technology offers the same opportunity to underwrite risks profitably (or at least not at a loss) but with a larger reach remains to be seen.

click to enlargeinsurance-business-models

It does occur to me that it may be successful in addressing areas of dislocation in the industry, such as shortfalls in coverage for flood insurance, where a common risk and mitigant can be identified and addressed in the terms of the respective pool taking the risks on.

For specialty re/insurers, we have already seen a bifurcation between the capital providers/risk takers and the risk portfolio managers in the ILS arena. Newer technology driven mutual based insurers also offer the industry a separation of the management of risk pools and the risk capital provided to underwrite them. I wish them well in their attempts at updating this most ancient of businesses and I repeat what I said in part 1 of this post – don’t let the sweet scent of shiny new technology distract you from the smell of the risk…..