The buzz from the annual insurance speed dating festival in Monte Carlo last week seems to have been subdued. Amid all the gossip about the M&A bubble, insurers and reinsurers tried to talk up a slowing of the rate of price decreases. Matt Weber of Swiss Re said “We’ve seen a slowing down of price decreases, although prices are not yet stable. We believe the trend will continue and we’ll see a stabilisation very soon”. However, analysts are not so sure. Moody’s stated that “despite strong signs that a more rational marketplace is emerging in terms of pricing, the expansion of alternative capital markets continues to threaten the traditional reinsurance business models”. Fitch commented that “a number of fundamental factors that influence pricing remain negative” and that “some reinsurers view defending market share by writing business below the technical price floor as being an acceptable risk”. KBW comment that on-going pricing pressures will “eventually compressing underwriting margins below acceptable returns”.
It is no surprise then that much of the official comments from firms focused on new markets and innovation. Moody’s states that “innovation is a defence against ongoing disintermediation, which is likely to become more pronounced in areas in which reinsurers are not able to maintain proprietary expertise”. Munich Re cited developing new forms of reinsurance cover and partnering with hi-tech industries to create covers for emerging risks in high growth industries. Aon Benfield highlighted three areas of potential growth – products based upon advanced data and analytics (for example in wider indemnification for financial institutions or pharmaceuticals), emerging risks such as cyber, and covering risks currently covered by public pools (like flood or mortgage credit). Others think the whole business model will change fundamentally. Stephan Ruoff of Tokio Millennium Re said “the traditional insurance and reinsurance value chain is breaking up and transforming”. Robert DeRose of AM Best commented that reinsurers “will have a greater transformer capital markets operation”.
Back in April 2013, I posed the question of whether financial innovation always ends in reduced risk premia (here). The risk adjusted ROE today from a well spread portfolio of property catastrophe business is reportingly somewhere between 6% and 12% today (depending upon who you ask and on how they calculate risk adjusted capital). Although I’d be inclined to believe more in the lower range, the results are likely near or below the cost of capital for most reinsurers. That leads you to the magic of diversification and the over hyped “non-correlated” feature of certain insurance risks to other asset classes. There’s little point in reiterating my views on those arguments as per previous posts here, here and here.
In the last post cited above, I commented that “the use by insurers of their economic capital models for reinsurance/retrocession purchases is a trend that is only going to increase as we enter into the risk based solvency world under Solvency II”. Dennis Sugrue of S&P said “we take some comfort from the strength of European reinsurers’ capital modelling capabilities”, which can’t but enhance the reputation of regulatory approved models under Solvency II. Some ILS funds, such as Twelve Capital, have set up subordinated debt funds in anticipation of the demand for regulatory capital (and provide a good comparison of sub-debt and reinsurance here).
One interesting piece of news from Monte Carlo was the establishment of a fund by Guy Carpenter and a new firm founded by ex-PwC partners called Vario Partners. Vario states on their website they were “established to increase the options to insurers looking to optimise capital in a post-Solvency II environment” and are proposing private bonds with collateral structured as quota share type arrangements with loss trigger points at 1-in-100 or 1-in-200 probabilities. I am guessing that the objective of the capital relief focussed structures, which presumably will use Vario proprietary modelling capabilities, is to allow investors a return by offering insurers an ability to leverage capital. As their website says “the highest RoE is one where the insurer’s shareholders’ equity is geared the most, and therefore [capital] at it’s thinnest”. The sponsors claim that the potential for these bonds could be six times that of the cat bond market. The prospects of allowing capital markets easy access to the large quota share market could add to the woes of the current reinsurance business model.
Low risk premia and leverage. Now that’s a good mix and, by all accounts, the future.
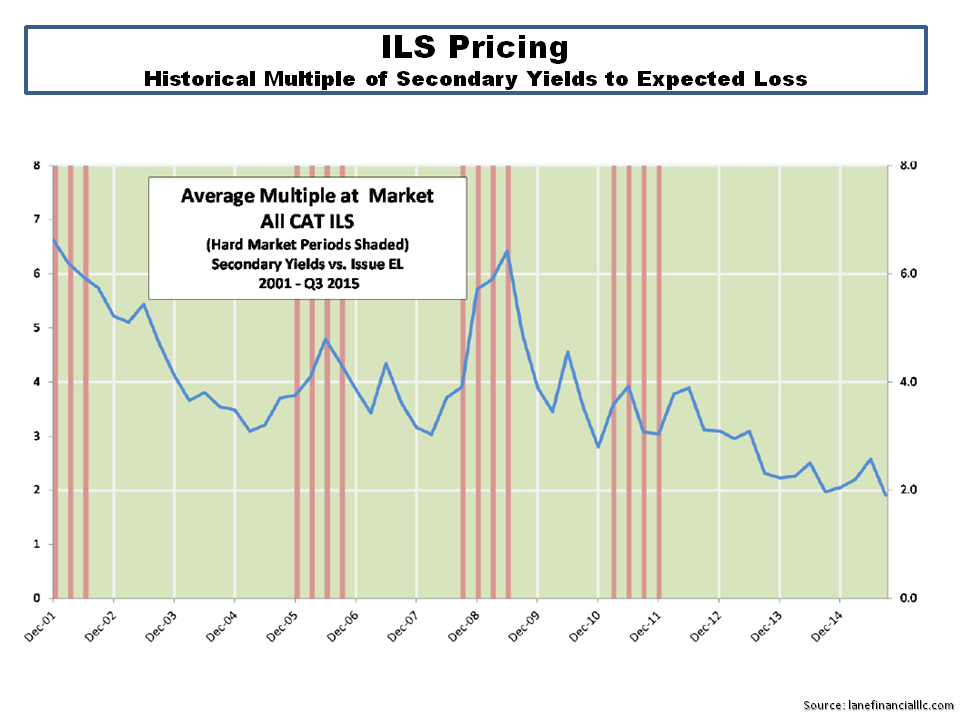
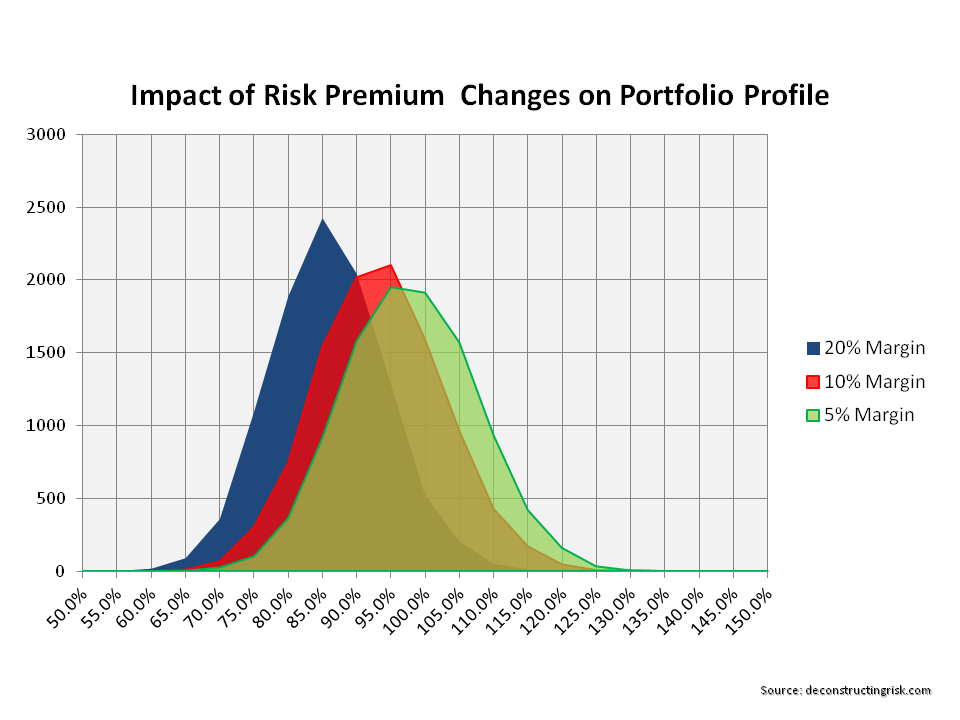
Follow-on (13th October 2015): Below are two graphs from the Q3 report from Lane Financial LLC which highlight the reduced risk premia prevalent in the ILS public cat bond market.
click to enlarge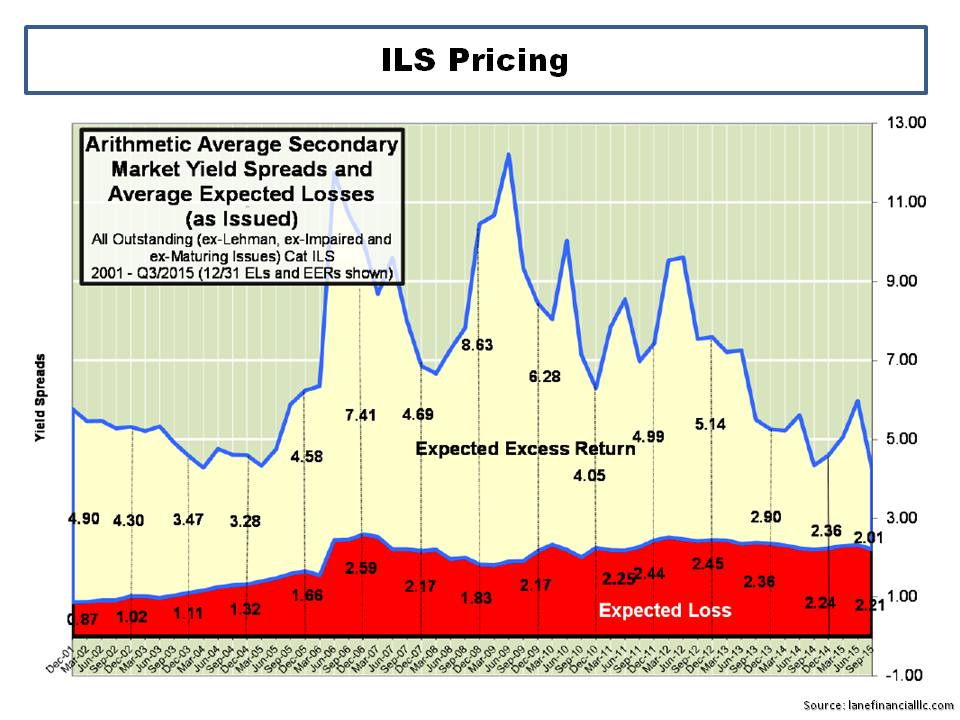
click to enlarge