Tag Archives: valuation multiples

A gaggle of bankers

How many investment bankers does it take to change a lightbulb? Well there are numerous jokes on that. Here’s one: two – one to take out the bulb and drop it and another one to sell it before it crashes!

In the case of the Level 3 (LVLT) and Centurylink (CTL) proposed merger (see previous post), it took no less than five investment banking firms according to the recent S4 filing to get a deal agreed. Centurylink had Bank of America Merrill Lynch and Morgan Stanley as its main advisors with Evercore added for another fairness opinion. Level 3 had Citi as its main advisor with Lazard for another fairness opinion.

The S4 also reveals that there was no auction process. Although both sides have no doubt talked to many potential partners about deals (both telecom firms have extensive M&A experience) in the recent past, this merger proposal really got started after discussions with the CEOs in May, initially about a LVLT purchase of CTL’s business segment and a tracking stock on the consumer business. The tracking stock idea quickly got dumped with the cash and share purchase of LVLT by CTL discussed in principle in September with the details agreed in October. Given the breakup fee is only around $2 a share for any alternative bidder, LVLT decided it was best to nail down the deal with CenturyLink rather than look for other deals. The S4 stated the following:

In light of the premium being proposed by CenturyLink, Level 3 management’s view of the relatively low likelihood of any potential alternate bidder being willing to make a superior proposal within a short time frame and the risk of potential leaks raised by pursuing such a pre-signing market check, coupled with the ability of any potential interested bidder to submit a competing offer following the signing of a definitive agreement with CenturyLink and the ability of Level 3 to terminate any definitive agreement with CenturyLink post-signing to accept a superior proposal from another bidder, the Level 3 Board determined at that time to continue pursuing the transaction proposed by CenturyLink without approaching other parties.

Relying on investment bankers to give fairness opinions could be viewed with scepticism by anybody with a memory and a sense of humour. However, in this case, I believe that the strategy is a sensible one for shareholders. The business segment of CTL and LVLT clearly makes sense as a match up with the possibility of significant synergies (more I think than has been assumed). The consumer side of the merged entity can always be offloaded at an opportune time in the future. Also, any other potential bidders of LVLT, such as Comcast or a technology firm like Goggle or Microsoft, will be forced now to act if they want the unique assets of the firm. My sense is that the possibility of another bidder emerging over the coming months remains low.

The financial projections, shown below, from management of each firm on a standalone basis are presented in the S4 and make for interesting reading.

click to enlargecenturylink-level3-projections

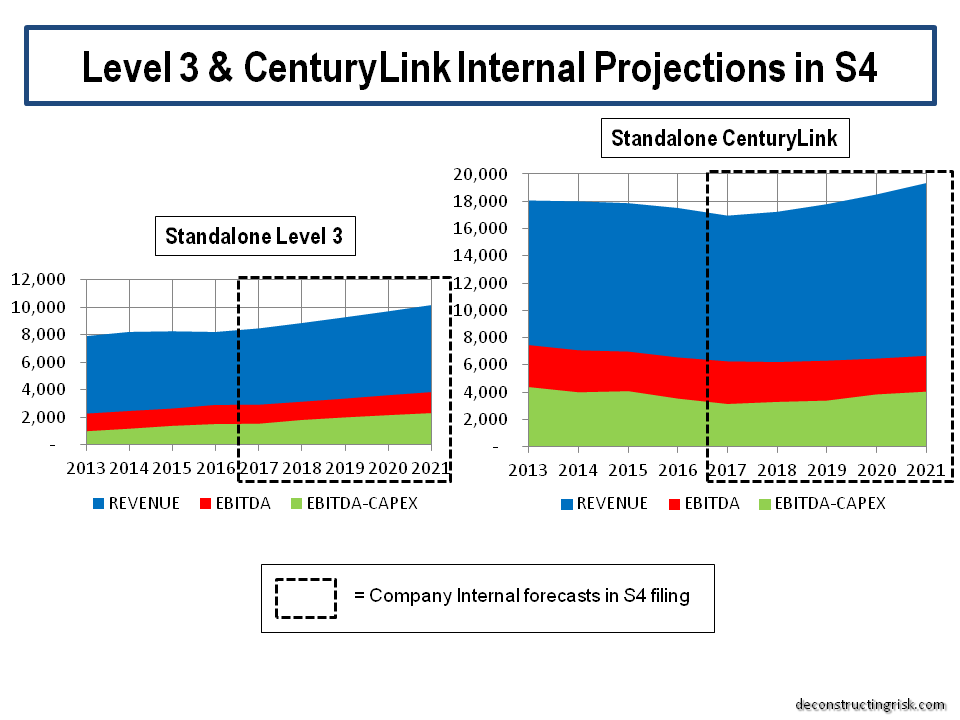
The projections for LVLT show higher capex figures for 2016 and 2017 than analyst estimates. From 2017 onwards, LVLT’s estimates of revenue are higher than analyst estimates whilst the resulting EBITDA is lower. This suggests a slower progression in EBITDA margins than analysts’ expectations with a figure closer to 35% and stable over the medium term. For CTL, the longer term revenue growth figures from the firm are more aggressive than analysts with EBITDA margins drifting down to the 35% level and below over the medium term.

It is unclear how many adjustments have been made by advisors to the figures provided by management of both firms. I am not that familiar with CTL’s figures but the LVLT figures look reasonable enough. The fairness opinions generally state that they reviewed the figures provided and the assumptions behind them without actually coming up with their own figures. The valuations of a standalone LVLT in an M&A context, and the assumptions behind the methods used, outlined in the S4 are shown below.

click to enlargelevel-3-valuations-from-s4-december-2016

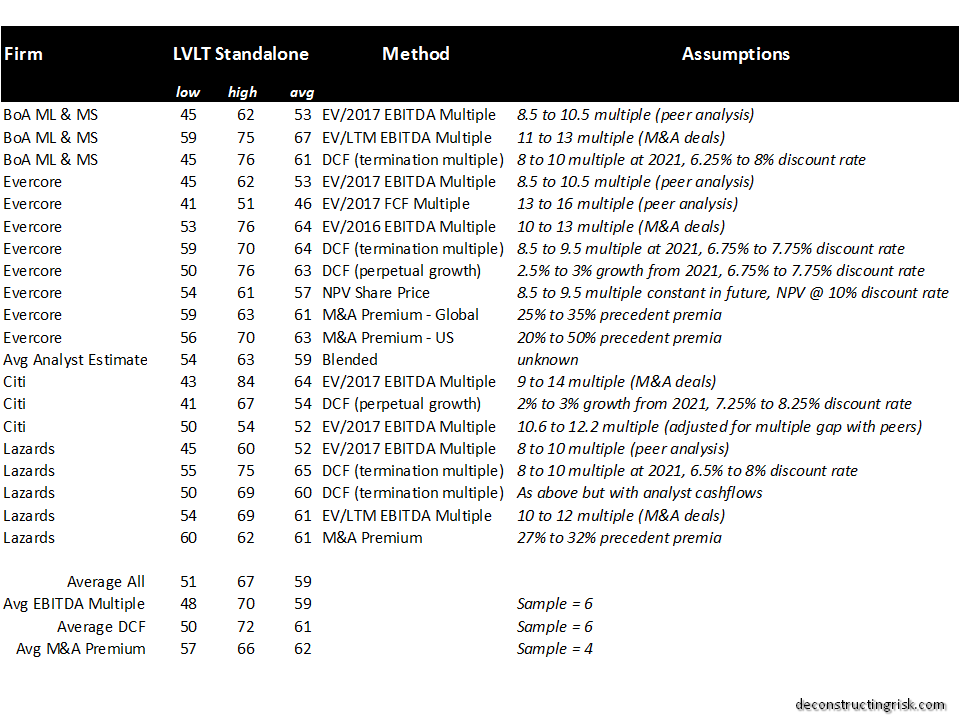
The valuations are generally consistent around a $60 per share level, varying from $50 to $70. Most include the value of the NOLs with Citi estimating their value separately at approximately $7 per share. A number of the bankers also valued the targeted synergies of the deal assuming 100% of these were assigned to LVLT shareholders. These estimates and the valuations of a standalone CTL are shown below.

click to enlargelvlt-and-ctl-valuations-from-s4-december-2016

Comparing the average LVLT standalone valuations and those including the synergies shows a value of $25 per share (i.e. $84-$59), assuming shareholders get 100% of the synergies. That assumption is clearly unrealistic. If 50% of the synergies were assigned to LVLT shareholders (who will get 49% of the combined entity), than a reasonable expectation in the longer run would be a value equivalent to $72 per share. As can be seen below, this is equivalent to a share price of $32 per share for CTL under the merger terms. BofA Merrill Lynch and Morgan Stanley in the S4 calculated a proforma value of CTL after the merger (with the synergies realised) of $34.75 which would put the value of the deal to LVLT shareholders around $76 per share, as below.

click to enlargecenturylink-level-3-merger-deal-2

With CTL’s stock still trading just over $24, there is obviously a lot that can happen before this proposed merger closes. And even more time before the deal synergies are realised. One thing is for sure through, the investment bankers are making out well as the exhibit on their fees below shows. $25 million alone for a few week’s work to provide the fairness opinions is outrageous.

click to enlargegaggle-of-bankers

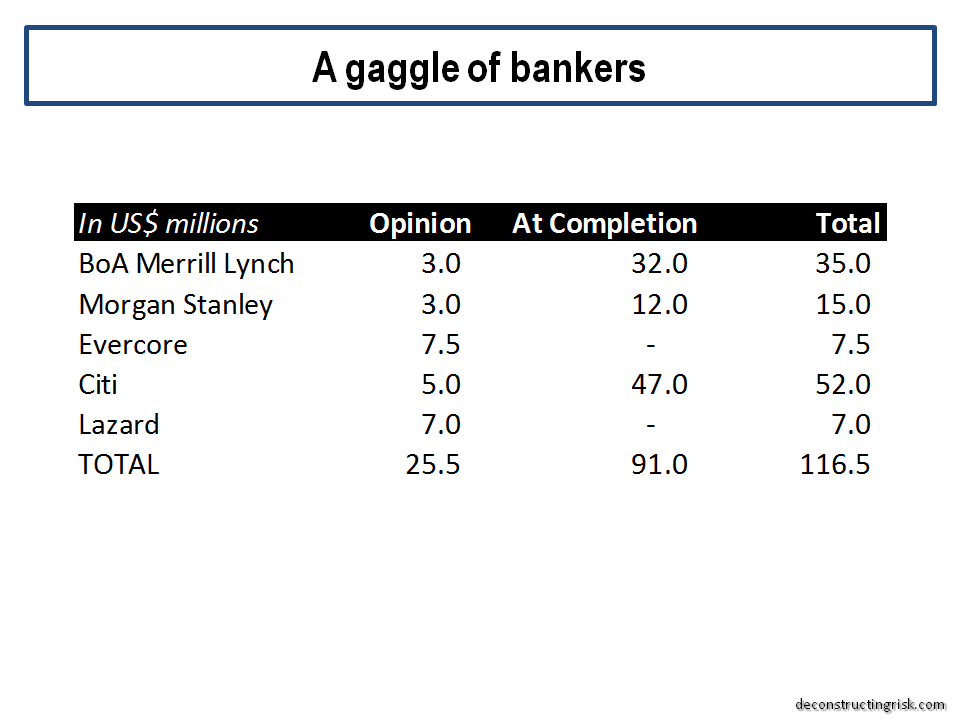
The amount of such fees investment bankers get away with charging always boggles the mind and shows what a closed shop the business still is. Whatever happens to LVLT and CTL shareholders, these masters of the universe always make out like bandits.

So….2016

As the first week of January progressed and markets tumbled, I was thinking about this post and couldn’t get away from the thought that 2016 feels very like 2015. The issues that were prominent in 2015 are those that will be so again in 2016 plus a few new ones. The UK vote on the EU and a US presidential race are just two new issues to go with China economic and political uncertainty, Middle East turmoil, Russian trouble making, a political crisis in Brazil, the insidious spread of terrorism, a move towards political extremes in developed countries and the on-going fault lines in Europe and the Euro. All of these macro factors together with earnings and the impact of rising interest rates are going to dominate 2016.

2015 joins two other years, 2011 and 1994, in being a -1% year for the S&P500 in recent times, as the graph below shows. In fact, the movements of the S&P500 in 2015 show remarkable similarity with 2011. However, there the similarities end. 2011 was the year of the Euro crisis, the Arab spring and the Japan quake. Interest rates were falling, earnings stable, and PE multiples were around 15. 1994 was even more different than 2015. In 1994, the economy was taking off and the Fed was aggressively raising rates, earnings were stable and PE multiples fell to around 15. Interesting the next 5 years after 1994 on the stock market were each 20%+ years! With 2015 around a 20 PE and earnings falling, the comparisons are not favourable and may even suggest we got off lightly with just a -1% fall.

click to enlargeS&P500 Years Down -1%

A recent article in the FT does point to the influence of a limited number of stocks on the 2015 performance with the top 10 stocks in the S&P500 up 14% in 2015 and the remaining 490 stocks down 5.8% collectively. The performance of the so-called nifty nine is shown below. The article highlights that “dominance by a few big companies – or a “narrowing” market – is a symptom of the end of a bull run, as it was in the early 1970s (dominated by the “Nifty Fifty”) or the late 1990s (dominated by the dot-coms).”

click to enlargeS&P500 vrs Nifty Nine

Bears have long questioned valuations. The impact of continuing falls in oil prices on energy earnings and a fall off in operating margins are signalling a renewed focus on valuations, as the events of this past week dramatically illustrate. A graph of the PE10 (aka Shiller CAPE) as at year end from the ever insightful Doug Short shows one measure of overvaluation (after this week’s fall the overvaluation on a PE10 basis is approx 30%).

click to enlargeS&P500 Valuation PE10 Doug Short

One of the longstanding bears, John Hussman, had an article out this week called “The Next Big Short”, in honour of the movie on the last big short. Hussman again cites his favourite metrics of the ratio of nonfinancial market capitalization to corporate gross value added (GVA) and the ratio of nonfinancial corporate debt to corporate GVA (right scale) as proof that “the financial markets are presently at a speculative extreme”.

click to enlargeHussman Market Cap to GVA

Many commentators are predicting a flat year for 2016 with some highlighting the likelihood of a meaningful correction. Whether the first week in January is the beginning of such a correction or just a blip along the path of a continually nervous market has yet to be seen. Analysts and their predictions for 2016 have been predictably un-inspiring as the graph below shows (particularly when compared to their 2015 targets).

click to enlarge2016 S&P500 Analyst Targets

Some, such as Goldman Sachs, have already started to reduce their EPS estimates, particularly for energy stocks given the increasingly negative opinions on oil prices through 2016. The 12 month forward PEs by sector, according to Factset Earning Insight dated the 8th of January as reproduced below, show the different multiples explicit in current estimates with the overall S&P500 at 15.7.

click to enlargeS&P500 Sector Forward PE Factset 08012016

Current earnings estimates for 2016 as per the latest Yardeni report (EPS growth graph is reproduced below), look to me to be too optimistic compared to the trends in 2015 and given the overall global economic outlook. Future downward revisions will further challenge multiples, particularly for sectors where earnings margins are stagnating or even decreasing.

click to enlargeS&P500 Earnings Growth 2016 Yardeni

To further illustrate the experts’ views on EPS estimates, using S&P data this time, I looked at the evolution in actual operating EPS figures and the 2015 and 2016 estimates by sector, as per the graph below.

click to enlargeS&P500 Operating EPS by sector

With US interest rates rising (albeit only marginally off generational lows), the dollar will likely continue its strength and higher borrowing costs will influence the environment for corporate profits. Pent up labour costs as slack in the US economy reduces may also start to impact corporate profits. In this context, the EPS estimates above look aggressive to me (whilst accepting that I do not have detailed knowledge on the reasoning behind the EPS increases in individual sectors such as health care or materials), particularly when global macro issues such as China are added into the mix.

So, as I stated at the start of this post, the outlook for 2016 is looking much like 2015. And perhaps even a tad worse.

Goodbye 2014, Hello 2015!

So, after the (im)piety of the Christmas break, its time to reflect on 2014 and look to the new year. As is always the case, the world we live in is faced with many issues and challenges. How will China’s economy perform in 2015? What about Putin and Russia? How strong may the dollar get? Two other issues which are currently on traders’ minds as the year closes are oil and Greece.

The drop in the price of oil, driven by supply/demand imbalances and geo-political factors in the Middle East, was generally unforeseen and astonishing swift, as the graph of European Brent below shows.

click to enlargeEuropean Brent Spot Price 2004 to 2014

Over the short term, the drop will be generally beneficial to the global economy, acting like a tax cut. At a political level, the reduction may even put manners on oil dependent states such as Iran and Russia. Over the medium to long term however, it’s irrational for a finite resource to be priced at such levels, even with the increased supply generated by new technologies like fracking (the longer term environmental impacts of which remain untested). The impact of a low oil price over the medium term would also have negative environmental impacts upon the need to address our carbon based economies as highlighted in 2014 by the excellent IPCC reports. I posted on such topics with a post on climate models in March, a post on risk and uncertainty in the IPCC findings in April, and another post on the IPCC synthesis reports in November.

The prospect of another round of structural stresses on the Euro has arisen by the calling of an election in late January in Greece and the possible success of the anti-austerity Syriza party. Although a Greek exit from the Euro seems unlikely in 2015, pressure is likely to be exerted for relief on their unsustainable debt load through write offs. Although banking union has been a positive development for Europe in 2014, a post in May on an article from Oxford Professor Kevin O’Rourke outlining the ultimate need to mutualise European commitments by way of a federal Europe to ensure the long term survival of the Euro. Recent commentary, including this article in the Economist, on the politics behind enacting any meaningful French economic reforms highlights how far Europe has to go. I still doubt that the German public can be convinced to back-stop the commitments of others across Europe, despite the competitive advantage that the relatively weak Euro bestows on Germany’s exporting prowess.

Perpetually, or so it seems, commentators debate the possible movements in interest rates over the coming 12 months, particularly in the US. A post in September on the findings of a fascinating report, called “Deleveraging, What Deleveraging?”, showed the high level of overall debt in the US and the rapid increase in the Chinese debt load. Although European debt levels were shown to have stabilised over the past 5 years, the impact of an aggressive round of quantitative easing in Europe on already high debt levels is another factor limiting action by the ECB. The impact of a move towards the normalisation of interest rates in the US on its economy and on the global economy remains one of the great uncertainties of our time. In 2015, we may just begin to see how the next chapter will play out.

Low interest rates have long been cited as a factor behind the rise in stock market valuations and any increase in interest rates remains a significant risk to equity markets. As the graph below attests, 2014 has been a solid if unspectacular year for nearly all equity indices (with the exception of the FTSE100), albeit with a few wobbles along the way, as highlighted in this October post.

click to enlarge2014 Stock Indices Performance

The debate on market valuations has been an ever-present theme of many of my posts throughout 2014. In a March post, I continued to highlight the differing views on the widely used cyclically adjusted PE (CAPE) metric. Another post in May highlighted Martin Wolf’s concerns on governments promoting cheap risk premia over an extended period as a rational long term policy. Another post in June, called Reluctant Bulls, on valuations summarized Buttonwood’s assertion that many in the market were reluctant bulls in the absence of attractive yields in other asset classes. More recently a post in September and a post in December further details the opposing views of such commentators as Jim Paulsen, Jeremy Siegel, Andrew Lapthorne, Albert Edwards, John Hussman, Philosophical Economics, and Buttonwood. The debate continues and will likely be another feature of my posts in 2015.

By way of a quick update, CAPE or the snappily named P/E10 ratio as used by Doug Short in a recent article on his excellent website shows the current S&P500 at a premium of 30% to 40% above the historical average. In his latest newsletter, John Hussman commented as follows:

“What repeatedly distinguishes bubbles from the crashes is the pairing of severely overvalued, overbought, overbullish conditions with a subtle but measurable deterioration in market internals or credit spreads that conveys a shift from risk-seeking to risk-aversion.”

Hussman points to a recent widening in spreads, as illustrated by a graph from the St Louis Fed’s FRED below, as a possible shift towards risk aversion.

click to enlargeFRED High Yield vrs AAA Spread Graph

The bull arguments are that valuations are not particularly stressed given the rise in earnings driven by changes to the mix of the S&P500 towards more profitable and internationally diverse firms. Critics counter that EPS growth is being flattered by subdued real wage inflation and being engineered by an explosion in share buybacks to the detriment of long term investments. The growth in quarterly S&P500 EPS, as illustrated below, shows the astonishing growth in recent years (and includes increasingly strong quarterly predicted EPS growth for 2015).

click to enlargeS&P500 Quarterly Operating & Reported EPS

A recent market briefing from Yardeni research gives a breakdown of projected forward PEs for each of the S&P500 sectors. Its shows the S&P500 index at a relatively undemanding 16.6 currently. In the graph below, I looked at the recent PE ratios using the trailing twelve month and forward 12 month operating EPS (with my own amended projections for 2015). It also shows the current market at a relatively undemanding level around 16, assuming operating EPS growth of approx 10% for 2015 over 2014.

click to enlargeS&P500 Operating PE Ratios

The focus for 2015 is therefore, as with previous years, on the sustainability of earnings growth. As a March post highlighted, there are concerns on whether the high level of US corporate profits can be maintained. Multiples are high and expectations on interest rates could make investors reconsider the current multiples. That said, I do not see across the board irrational valuations. Indeed, at a micro level, valuations in some sectors seem very rational to me as do those for a few select firms.

The state of the insurance sector made up the most frequent number of my posts throughout 2014. Starting in January with a post summarizing the pricing declines highlighted in the January 2014 renewal broker reports (the 2015 broker reports are due in the next few days). Posts in March and April and November (here, here and here) detailed the on-going pricing pressures throughout the year. Other insurance sector related posts focussed on valuation multiples (here in June and here in December) and sector ROEs (here in January, here in February and here in May). Individual insurance stocks that were the subject of posts included AIG (here in March and here in September) and Lancashire (here in February and here in August). In response to pressures on operating margins, M&A activity picking up steam in late 2014 with the Renaissance/Platinum and XL/Catlin deals the latest examples. When seasoned executives in the industry are prepared to throw in the towel and cash out you know market conditions are bad. 2015 looks to be a fascinating year for this over-capitalised sector.

Another sector that is undergoing an increase in M&A activity is the telecom sector, as a recent post on Europe in November highlighted. Level3 was one of my biggest winners in 2014, up 50%, after another important merger with TW Telecom. I remain very positive on this former basket case given its operational leverage and its excellent management with a strong focus on cash generation & debt reduction (I posted on TWTC in February and on the merger in June and July). Posts on COLT in January and November were less positive on its prospects.

Another sector that caught my attention in 2014, which is undergoing its own disruption, is the European betting and online gambling sector. I posted on that sector in January, March, August and November. I also posted on the fascinating case of Betfair in July. This sector looks like one that will further delight (for the interested observer rather than the investor!) in 2015.

Other various topics that were the subject of posts included the online education sector in February, Apple in May, a dental stock in August, and Trinity Biotech in August and October. Despite the poor timing of the August TRIB call, my view is that the original investment case remains intact and I will update my thoughts on the topic in 2015 with a view to possibly building that position once the selling by a major shareholder subsides and more positive news on their Troponin trials is forthcoming. Finally, I ended the year having a quick look at Chinese internet stocks and concluded that a further look at Google was warranted instead.

So that’s about it for 2014. There was a few other random posts on items as diverse as a mega-tsunami to correlations (here and here)!

I would like to thank everybody who have taken the time to read my ramblings. I did find it increasingly difficult to devote quality time to posting as 2014 progressed and unfortunately 2015 is looking to be similarly busy. Hopefully 2015 will provide more rich topics that force me to find the time!

A very happy and health 2015 to all those who have visited this blog in 2014.

An Unhappy New Year for Reinsurers?

The broker reports on the January renewals paint a picture of building pricing pressures for reinsurers and specialty insurers. The on-going disintermediation in the property catastrophe market by new capital market capacity is causing pricing pressures to spill over into other classes, specifically on other non-proportional risks and on ceding commissions on proportional business.

The Guy Carpenter report  highlight that traditional players are fighting back on terms and conditions through “an extension of hours clauses, improved reinstatement provisions and expanded coverage for terror exposures” and “many reinsurers offered more tailored coverage utilizing options such as aggregate and quota share cover, multi-year arrangements and early signing opportunities at reduced pricing”. Guy Carpenter also point to large buyers looking at focusing “their programs on a smaller group of key counter-party relationships that were meaningful in relation to the overall size of the program”.

The Aon Benfield report and the Willis Re report also highlight the softening of terms and conditions to counteract cheap ILS capacity emphasising items such as changes in reinstatement terms.  Willis states that “the impact of overcapacity has been most clearly evidenced by the up to 25% risk adjusted rate reductions seen on U.S. Property Catastrophe renewals at 1 January and the more modest but still significant rate reductions of up to 15% on International Property Catastrophe renewals”.

Following an increase in valuation multiples from all time lows for the sector over the past 24 months, the current headwinds for the sector as a result of over-supply and reduced demand mean, in my opinion, that now is a good time for investors to reduce all exposure to the sector and move to the side-lines. I particularly agree with a comment in the Willis report that “experienced reinsurers will remember that the relaxation of terms and conditions more so than price reduction caused the real damage in the last soft market cycle”. Meaningful upside from here just doesn’t look on the cards to me particularly when compared to the downside risks (even M&A activity is likely to be with limited premium and/or on an all stock basis).

The graph below shows the premium split by main product line for the firms that I monitor. The firms have been sorted left to right (low to high exposure) by a subjective factor based upon exposure to the current pricing pressures. The factor was calculated using a combination of a market pricing reduction factor for each of the main business classes based upon the pricing indicated in the broker reports and upon individual business class discounts for each firm depending upon their geographical diversification and the stickiness of the business written. The analysis is fairly subjective and as many of the firms classify business classes differently the graph should be considered cautiously with a pinch of salt.

click to enlargePremium Split Specialty Insurers & Reinsurers

Unsurprisingly, reinsurers with a property catastrophe focus and with limited business class diversification look the most exposed. The impact of the reduced pricing on accident year ratios need to be combined with potential movement in reserves to get the impact on calendar year operating results. Unfortunately, I don’t have the time at the moment to do such an analysis on a firm by firm basis so the graph below simply compares the subjective pricing factor that I calculated against average operation ROEs from 2009 to Q3 2013.

click to enlargeSpecialty Insurers & Reinsurers Exposure to Pricing Pressures

As stated previously, the whole sector is one I would avoid completely at the moment but the graph above suggests that those firms on the right, specifically those in the lower right hand quadrant, are particularly exposed to the on-going pricing pressures.

High Beta Delight: Level 3 at $30

Following up on a previous post, Level 3 Communications (LVLT) has had a good run since June, breaking out of its trading range and holding around $30. Over the past 2 years, a successful trading strategy on LVLT would have been buying around $20 and selling in the high twenties, so I would expect traders of LVLT to take some profits (also there may be more shares on the market towards the end of the month after LVLT recently called some convertible debt). Given the historical volatility in LVLT and the market high valuations, a pull-back seems inevitable in the short term although over the medium term I have an increasing conviction that the future for LVLT’s long suffering equity holders is bright.

click to enlargeLevel3 Share Price

The recent increase has been driven by improving operating metrics, as per the graph on revenues and EBITDA margin below, and improved valuation multiples in the sector, as can be seen from a graphic on telecomrambings, plus the general increase in market valuations.

click to enlargeLevel3 Operating Metrics November 2013

LVLT has also been working hard on getting its oversized debt load (as at Q3 net debt was approx $8 billion) down to a more manageable size. To date in Q4, the firm managed to refinance approx $1 billion of debt and convert another $200 million. As LVLT achieves sustainable FCF in 2014, a virtuous circle of increased operating margins and reduced debt servicing may follow, vastly improving the credit profile of this once basket case (credit risk wise). The debt tinkering should reduce the average interest rate by 30 bps to 6.9% for year end and, assuming 2014 EBITDA of $1.8 billion, will reduce the net debt to EBITDA multiple from the current 5.2 to a more manageable 4.4.

The analysts have all increased their targets on the back of the recent results under the new leadership of Jeff Storey. UBS AG, Canaccord and DA Davidson are at $30, Goldman Sachs has $34, Cowen has $39, Deutsche Bank is at $40 (although this includes $8 of NOLs).

It’s important to again stress that LVLT has a very volatile history and is not for the weak hearted. YahooFinance calculates the current beta for LVLT at 1.8. The graph below illustrates historical weekly volatility versus the S&P500. There is also an analysis of the relationship between the S&P500 and LVLT since 2009 – LVLT moved with the market 66% of the time (3.2 times on average the market move on the way up and 2.7 times on the way down!), 22% of the time when the S&P was up LVLT was down (by a factor of 3!), and 12% of the time when the S&P was down LVLT was up (by a factor of 6.5!).

click to enlargeMonthly Volatility Level 3 S&P500 2003 to 2013

In an update of the highly influential paper by Andrea Frazzini and Lasse Pedersen called “Betting against Beta”, the authors test a number of investing strategies around beta and state that ”we find empirically that portfolios of high-beta assets have lower alphas and Sharpe ratios than portfolios of low-beta assets”. Although I would caution about short term volatility and an overexcited US equity market currently, I am hopeful that the days of LVLT being a pin-up for the high beta side are numbered.