Category Archives: General

Goodbye 2014, Hello 2015!

So, after the (im)piety of the Christmas break, its time to reflect on 2014 and look to the new year. As is always the case, the world we live in is faced with many issues and challenges. How will China’s economy perform in 2015? What about Putin and Russia? How strong may the dollar get? Two other issues which are currently on traders’ minds as the year closes are oil and Greece.

The drop in the price of oil, driven by supply/demand imbalances and geo-political factors in the Middle East, was generally unforeseen and astonishing swift, as the graph of European Brent below shows.

click to enlargeEuropean Brent Spot Price 2004 to 2014

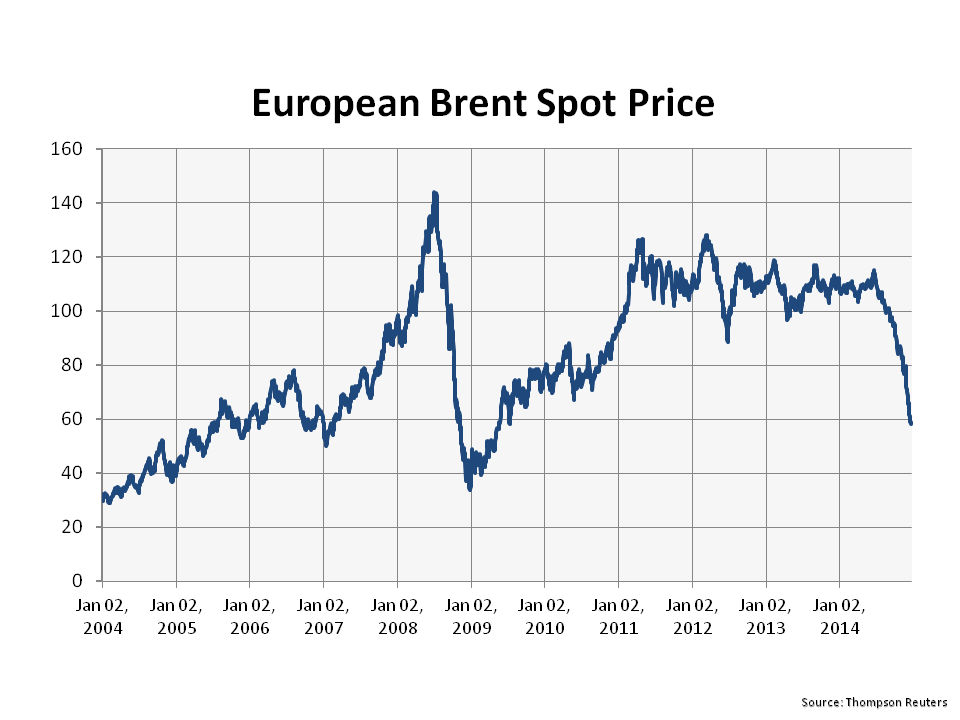
Over the short term, the drop will be generally beneficial to the global economy, acting like a tax cut. At a political level, the reduction may even put manners on oil dependent states such as Iran and Russia. Over the medium to long term however, it’s irrational for a finite resource to be priced at such levels, even with the increased supply generated by new technologies like fracking (the longer term environmental impacts of which remain untested). The impact of a low oil price over the medium term would also have negative environmental impacts upon the need to address our carbon based economies as highlighted in 2014 by the excellent IPCC reports. I posted on such topics with a post on climate models in March, a post on risk and uncertainty in the IPCC findings in April, and another post on the IPCC synthesis reports in November.

The prospect of another round of structural stresses on the Euro has arisen by the calling of an election in late January in Greece and the possible success of the anti-austerity Syriza party. Although a Greek exit from the Euro seems unlikely in 2015, pressure is likely to be exerted for relief on their unsustainable debt load through write offs. Although banking union has been a positive development for Europe in 2014, a post in May on an article from Oxford Professor Kevin O’Rourke outlining the ultimate need to mutualise European commitments by way of a federal Europe to ensure the long term survival of the Euro. Recent commentary, including this article in the Economist, on the politics behind enacting any meaningful French economic reforms highlights how far Europe has to go. I still doubt that the German public can be convinced to back-stop the commitments of others across Europe, despite the competitive advantage that the relatively weak Euro bestows on Germany’s exporting prowess.

Perpetually, or so it seems, commentators debate the possible movements in interest rates over the coming 12 months, particularly in the US. A post in September on the findings of a fascinating report, called “Deleveraging, What Deleveraging?”, showed the high level of overall debt in the US and the rapid increase in the Chinese debt load. Although European debt levels were shown to have stabilised over the past 5 years, the impact of an aggressive round of quantitative easing in Europe on already high debt levels is another factor limiting action by the ECB. The impact of a move towards the normalisation of interest rates in the US on its economy and on the global economy remains one of the great uncertainties of our time. In 2015, we may just begin to see how the next chapter will play out.

Low interest rates have long been cited as a factor behind the rise in stock market valuations and any increase in interest rates remains a significant risk to equity markets. As the graph below attests, 2014 has been a solid if unspectacular year for nearly all equity indices (with the exception of the FTSE100), albeit with a few wobbles along the way, as highlighted in this October post.

click to enlarge2014 Stock Indices Performance

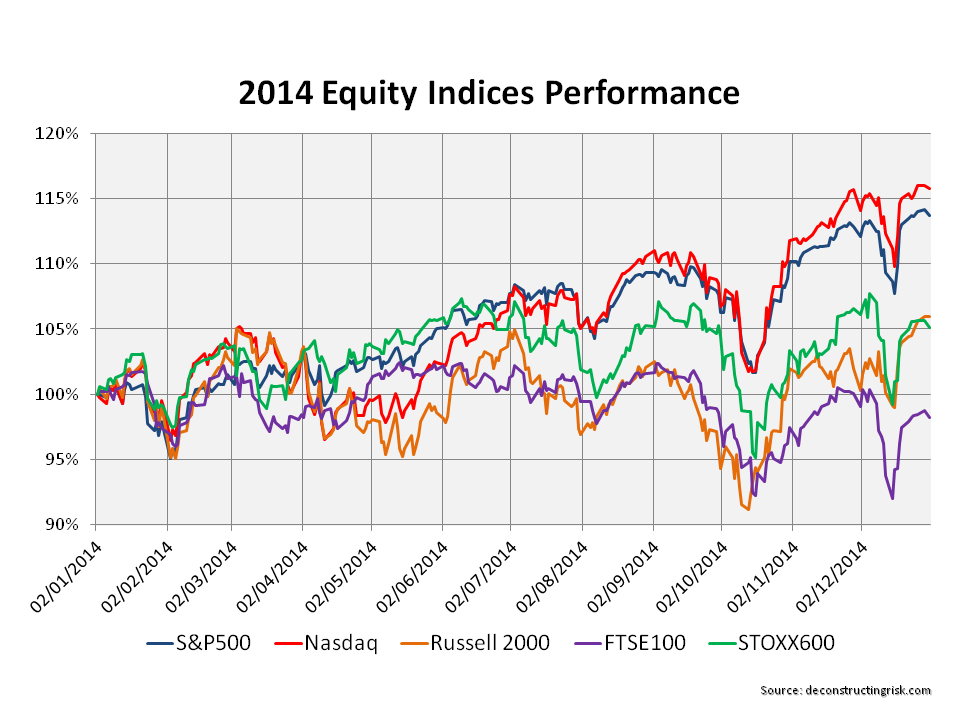
The debate on market valuations has been an ever-present theme of many of my posts throughout 2014. In a March post, I continued to highlight the differing views on the widely used cyclically adjusted PE (CAPE) metric. Another post in May highlighted Martin Wolf’s concerns on governments promoting cheap risk premia over an extended period as a rational long term policy. Another post in June, called Reluctant Bulls, on valuations summarized Buttonwood’s assertion that many in the market were reluctant bulls in the absence of attractive yields in other asset classes. More recently a post in September and a post in December further details the opposing views of such commentators as Jim Paulsen, Jeremy Siegel, Andrew Lapthorne, Albert Edwards, John Hussman, Philosophical Economics, and Buttonwood. The debate continues and will likely be another feature of my posts in 2015.

By way of a quick update, CAPE or the snappily named P/E10 ratio as used by Doug Short in a recent article on his excellent website shows the current S&P500 at a premium of 30% to 40% above the historical average. In his latest newsletter, John Hussman commented as follows:

“What repeatedly distinguishes bubbles from the crashes is the pairing of severely overvalued, overbought, overbullish conditions with a subtle but measurable deterioration in market internals or credit spreads that conveys a shift from risk-seeking to risk-aversion.”

Hussman points to a recent widening in spreads, as illustrated by a graph from the St Louis Fed’s FRED below, as a possible shift towards risk aversion.

click to enlargeFRED High Yield vrs AAA Spread Graph

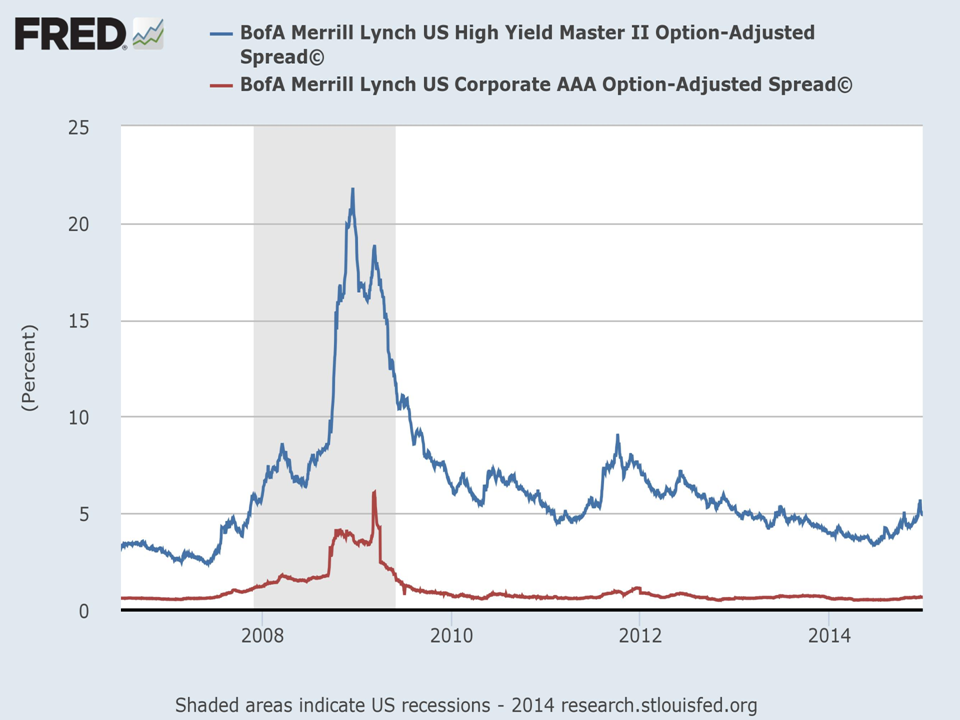
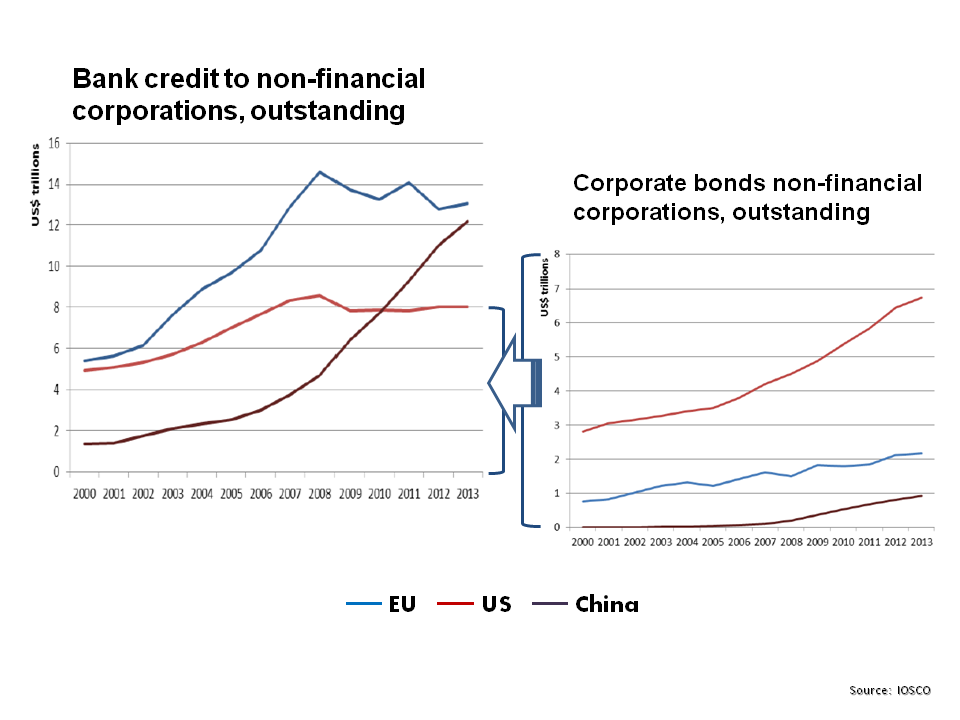
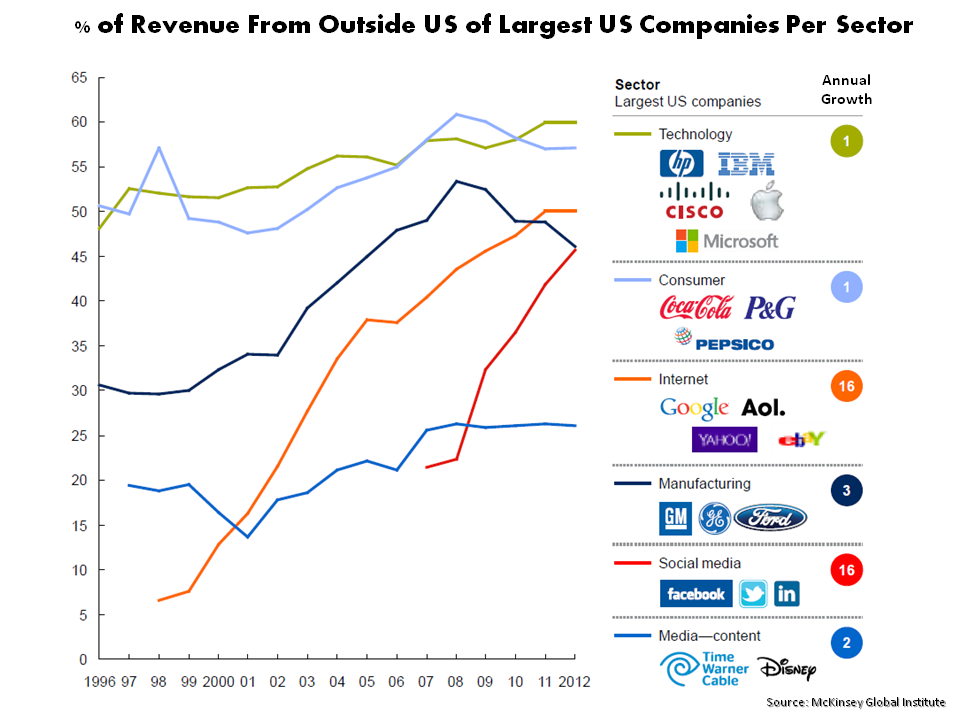
The bull arguments are that valuations are not particularly stressed given the rise in earnings driven by changes to the mix of the S&P500 towards more profitable and internationally diverse firms. Critics counter that EPS growth is being flattered by subdued real wage inflation and being engineered by an explosion in share buybacks to the detriment of long term investments. The growth in quarterly S&P500 EPS, as illustrated below, shows the astonishing growth in recent years (and includes increasingly strong quarterly predicted EPS growth for 2015).

click to enlargeS&P500 Quarterly Operating & Reported EPS

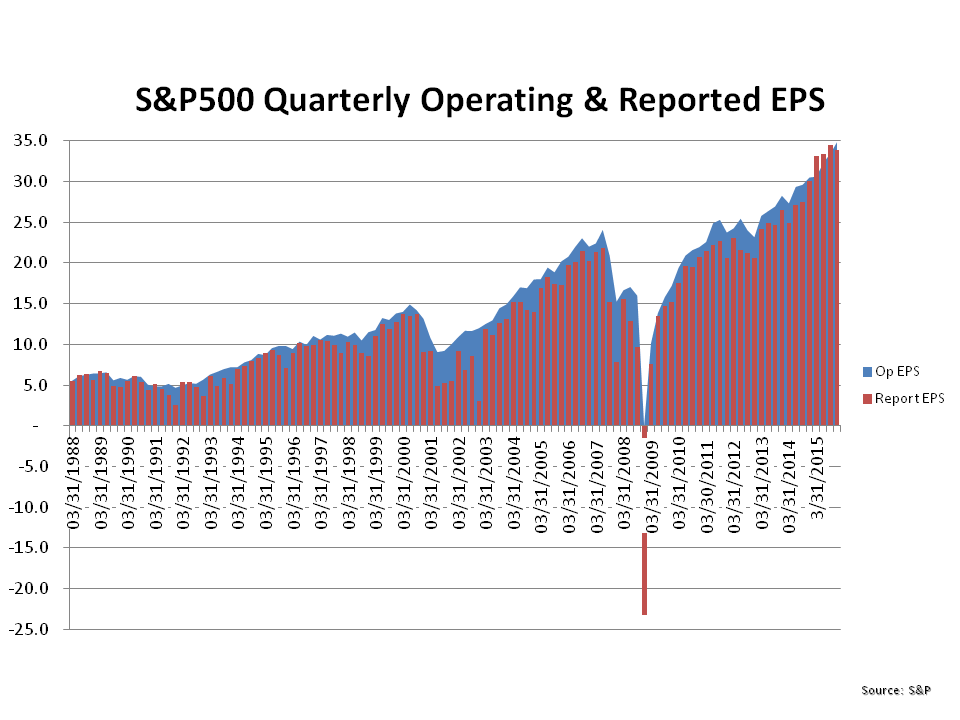
A recent market briefing from Yardeni research gives a breakdown of projected forward PEs for each of the S&P500 sectors. Its shows the S&P500 index at a relatively undemanding 16.6 currently. In the graph below, I looked at the recent PE ratios using the trailing twelve month and forward 12 month operating EPS (with my own amended projections for 2015). It also shows the current market at a relatively undemanding level around 16, assuming operating EPS growth of approx 10% for 2015 over 2014.

click to enlargeS&P500 Operating PE Ratios

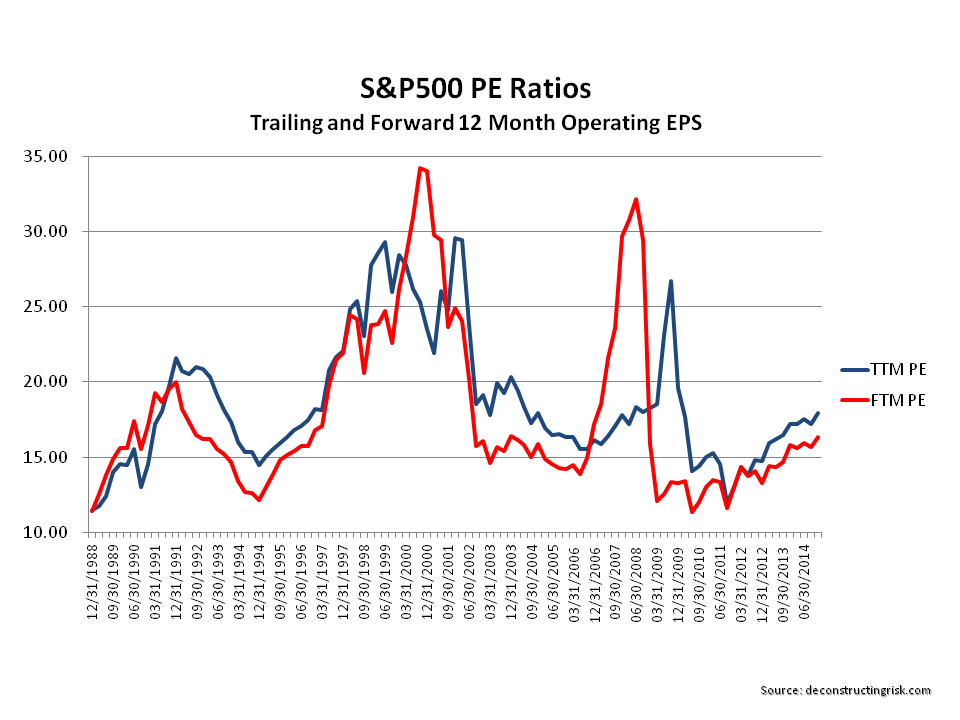
The focus for 2015 is therefore, as with previous years, on the sustainability of earnings growth. As a March post highlighted, there are concerns on whether the high level of US corporate profits can be maintained. Multiples are high and expectations on interest rates could make investors reconsider the current multiples. That said, I do not see across the board irrational valuations. Indeed, at a micro level, valuations in some sectors seem very rational to me as do those for a few select firms.

The state of the insurance sector made up the most frequent number of my posts throughout 2014. Starting in January with a post summarizing the pricing declines highlighted in the January 2014 renewal broker reports (the 2015 broker reports are due in the next few days). Posts in March and April and November (here, here and here) detailed the on-going pricing pressures throughout the year. Other insurance sector related posts focussed on valuation multiples (here in June and here in December) and sector ROEs (here in January, here in February and here in May). Individual insurance stocks that were the subject of posts included AIG (here in March and here in September) and Lancashire (here in February and here in August). In response to pressures on operating margins, M&A activity picking up steam in late 2014 with the Renaissance/Platinum and XL/Catlin deals the latest examples. When seasoned executives in the industry are prepared to throw in the towel and cash out you know market conditions are bad. 2015 looks to be a fascinating year for this over-capitalised sector.

Another sector that is undergoing an increase in M&A activity is the telecom sector, as a recent post on Europe in November highlighted. Level3 was one of my biggest winners in 2014, up 50%, after another important merger with TW Telecom. I remain very positive on this former basket case given its operational leverage and its excellent management with a strong focus on cash generation & debt reduction (I posted on TWTC in February and on the merger in June and July). Posts on COLT in January and November were less positive on its prospects.

Another sector that caught my attention in 2014, which is undergoing its own disruption, is the European betting and online gambling sector. I posted on that sector in January, March, August and November. I also posted on the fascinating case of Betfair in July. This sector looks like one that will further delight (for the interested observer rather than the investor!) in 2015.

Other various topics that were the subject of posts included the online education sector in February, Apple in May, a dental stock in August, and Trinity Biotech in August and October. Despite the poor timing of the August TRIB call, my view is that the original investment case remains intact and I will update my thoughts on the topic in 2015 with a view to possibly building that position once the selling by a major shareholder subsides and more positive news on their Troponin trials is forthcoming. Finally, I ended the year having a quick look at Chinese internet stocks and concluded that a further look at Google was warranted instead.

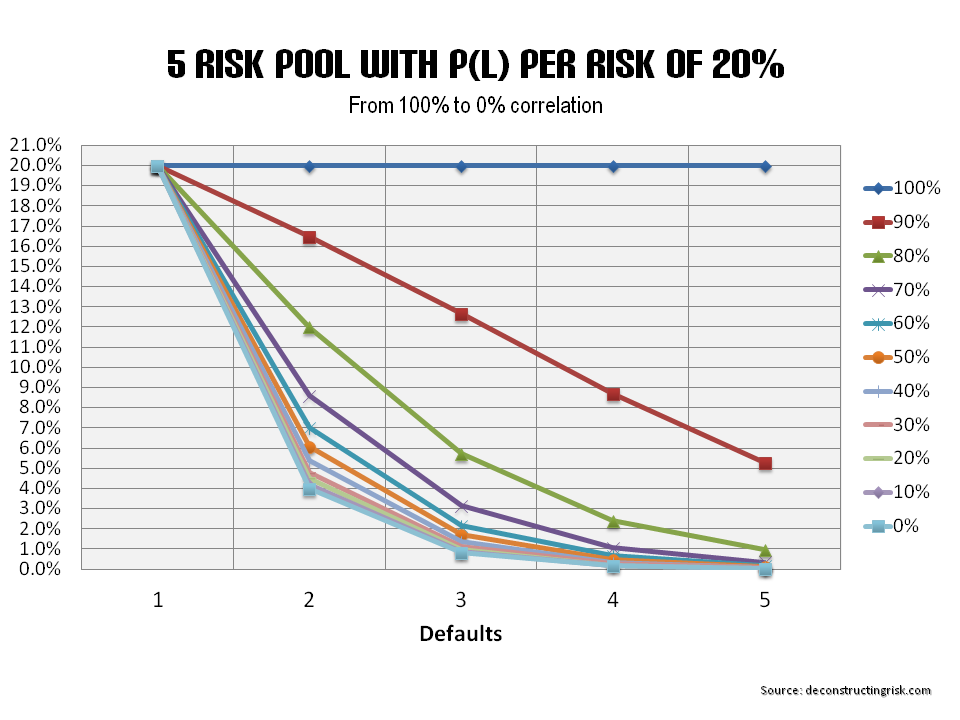
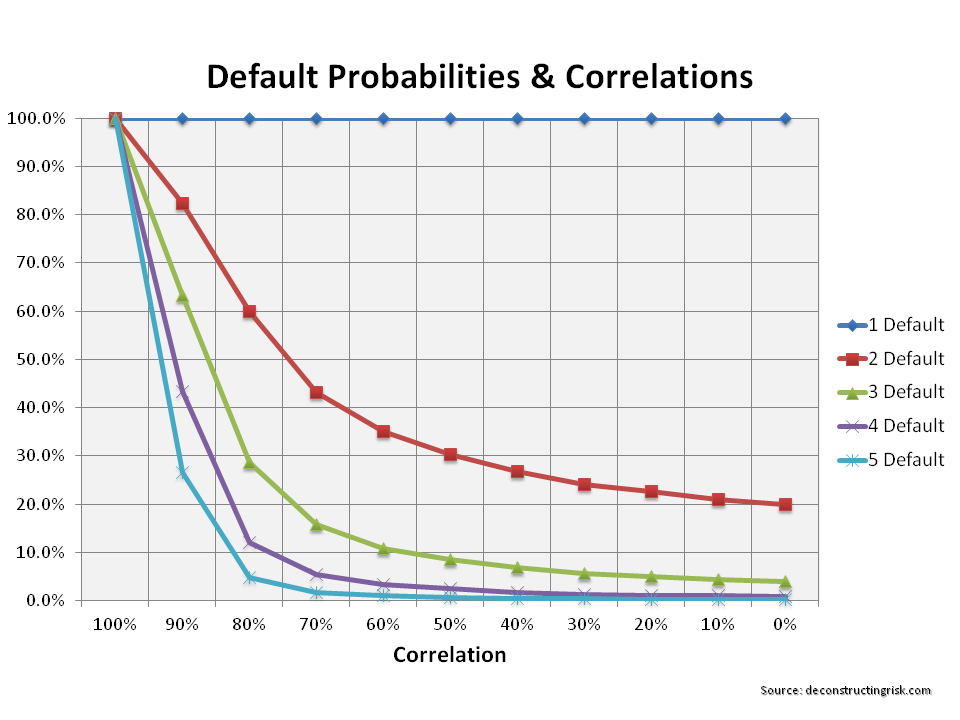
So that’s about it for 2014. There was a few other random posts on items as diverse as a mega-tsunami to correlations (here and here)!

I would like to thank everybody who have taken the time to read my ramblings. I did find it increasingly difficult to devote quality time to posting as 2014 progressed and unfortunately 2015 is looking to be similarly busy. Hopefully 2015 will provide more rich topics that force me to find the time!

A very happy and health 2015 to all those who have visited this blog in 2014.

From tera to zetta and beyond to yotta

One of the great lessons of the internet crash was that the exponential growth in internet activity did not mean a similar level of growth in revenues for many of the new business models which were hyped. I can remember an insightful report before the crash which added up all the expected top-line growth projections and concluded that household expenditure on internet services would have to amount to 30% to 40% of household expenditures if projections were to be met!! Although on a personal basis household expenditure on internet access does seem to be growing all the time, it’s not at anything like the growth in our usage. Not yet anyway!

The graphs below shows the growth in global internet traffic from 2001 to 2012 according to Cisco, split by IP, fixed and mobile internet traffic. Although not on the same scale but in a similar vein, the lower graph shows the monthly peering traffic recorded over the Amsterdam Internet Exchange from July 2001 to May 2014

click to enlarge
Historical Internet Growth

For reference, gigabyte/terabyte/petabyte/exabyte/zettabyte/yottabyte is a kilobyte to the power of 3, 4, 5, 6, 7 and 8 respectively.

According to the latest projections from Cisco in their report this month “ The Zettabyte Era – Trends and Analysis”, global IP traffic will surpass the zettabyte threshold by the end of 2016 growing by approximately 20% per annum. Global IP traffic has increased fivefold over the past 5 years, and Cisco predicts an increase of threefold over the next 5 years.

click to enlarge
IP Growth Cisco June 2014 projections

The graph below illustrates the changes in devices used to access the internet behind Cisco’s projections.

click to enlarge
Connected Devices Cisco predictions June 2014

The report highlights a number of core trends including the following:
1) Transition to newer devices will alter network demand and usage.
2) M2M growth will drive the internet of everything.
3) Fixed broadband speeds will nearly triple by 2018.
4) Wi-Fi will dominate access technology.
5) Metro traffic will grow nearly twice as fast as long-haul traffic.
6) IP video will accelerate IP traffic growth through 2018.
7) Bottlenecks may result between peak and average demand times.

Bring on the yotta era!

IOSCO Report on Corporate Bonds

Staff from IOSCO issued a report in April on the global corporate bond market. Although there was nothing earth shattering in the report, there was some interesting insights. The report highlighted 4 themes as below:

  1. Corporate bond markets have become bigger, more important for the real economy, and increasingly global in nature.
  2. Corporate bond markets have begun to fill an emerging gap in bank lending and long-term financing and are showing potential for servicing SME financing needs.
  3. A search for yield is driving investment in corporate bond markets. A changing interest rate environment will create winners and losers.
  4. Secondary markets are also transforming to adapt to a new economic and regulatory environment. Understanding the nature and reasons for this transformation is key in identifying future potential systemic risk issues and opportunities for market development.

The report also highlights the uncertainty that remains on secondary markets in the event of a interest rate shock and the $11 trillion worth of corporate debt (out of $50 trillion) due to mature in the next seven years.

Some interesting graphs in the report include the one below on the different characteristics of issuances pre- and post- 2007.

click to enlargeIOSCO Pre2007 and Post2007 Corporate Bond Issuance April 2014

Other interesting graphs highlight how corporate bonds are taking up the stagnation in bank credit in the US and the EU, and also highlight the boom in bank credit in China, as below.

click to enlargeIOSCO Bank Credit and Corporate Bond Markets April 2014

And finally the graphs below show the increase in non-financial corporate bond issuance and the modest growth in high yield issuance.

click to enlargeIOSCO Corporate Bond Markets April 2014


MGI Global Flows In A Digital Age Report

McKinsey Global Institute has an interesting report out entitled “Global flows in a digital age: How trade, finance, people, and data connect the world economy”. The report goes into different aspects of flows across the globe with a central assertion as follows:

Two major forces are now accelerating the growth and evolution of global flows. The first is increasing global prosperity. By 2025, 1.8 billion people around the world will enter the consuming class, nearly all from emerging markets, and emerging-market consumers will spend $30 trillion annually, up from $12 trillion today. This will create enormous new hubs for consumer demand and global production. The second major force is the growing pervasiveness of Internet connectivity and the spread of digital technologies. More than two-thirds of us have mobile phones. In 2012, there were 2.7 billion people connected to the Internet. A torrent of data now travels around the world. Cross-border Internet traffic grew 18-fold between 2005 and 2012.

One graph in the report that caught my attention was the one below of the growth in foreign revenues from top US firms across different sectors. This is interesting and feeds directly into some of the contentions asserted by Jeremy Siegel in justifying a high CAPE ratio (as discussed in this post).

click to enlargeMGI Revenue % of US firms from foreign markets

What is interesting about the graph above is the fall in the manufacturing firms since the financial crisis and the relatively slow growth of revenues outside of the US from the “established” technology and consumer firms in the US. Given the growth in global flows, it suggests they need to be more focused on the opportunities outside the US, particularly if the graph below on future consumption in 2025 turns out to accurate.

click to enlargeMGI emerging economies per capita GDP

I was particularly taken with the pieces of the report in relation to the impact of the internet and e-commerce. The following extract highlighted the impact:

“The power of digitization comes especially from its marginal cost economics that reduce costs associated with access, discovery, and distribution of goods and services to nearly zero. As a result, the cost of participating in flows is lowered for individuals, small firms, and entrepreneurs. This is already leading not only to innovations in business models but also to the emergence of micromultinationals, microwork, and microsupply chains that are able to tap into global opportunities. This significantly removes barriers to participating in global flows, broadening opportunities. It also will put pressure on all companies to innovate their business models to capture the opportunities and respond to new sources of competition, and to counter the pressure on their existing business models from digitization’s marginal-cost economics.”

The graph below shows the changes in data and communication flows over the past 5 years. The growth in traffic between the US and China and between the US and Latin America is noteworthy.

click to enlargeMGI data & communication change 2008 to 2013

The report does highlight that emerging economies lag significantly behind developed economies in cross-border internet traffic with impediments to growth such as high bandwidth prices and IP transit costs. The graph below highlights the dominance of the developed economies in areas such as content and online sales.

click to enlargeMGI emerging economies Internet & Data

It does however also show how things may grow as emerging economies take advantage of the power of the wired world. As the report states: “the pace of change is likely to accelerate even more dramatically as more of the world goes online”.

There is some other interesting stuff in the MGI report and its worth a quick read.

Confounding correlation

Nassim Nicholas Taleb, the dark knight or rather the black swan himself, said that “anything that relies on correlation is charlatanism”.  I am currently reading the excellent “The signal and the noise” by Nate Silver. In Chapter 1 of the book he has a nice piece on CDOs as an example of a “catastrophic failure of prediction” where he points to certain CDO AAA tranches which were rated on an assumption of a 0.12% default rate and which eventually resulted in an actual rate of 28%, an error factor of over 200 times!.

Silver cites a simplified CDO example of 5 risks used by his friend Anil Kashyap in the University of Chicago to demonstrate the difference in default rate if the 5 risks are assumed to be totally independent and dependent.  It got me thinking as to how such a simplified example could illustrate the impact of applied correlation assumptions. Correlation between core variables are critical to many financial models and are commonly used in most credit models and will be a core feature in insurance internal models (which under Solvency II will be used to calculate a firms own regulatory solvency requirements).

So I set up a simple model (all of my models are generally so) of 5 risks and looked at the impact of varying correlation from 100% to 0% (i.e. totally dependent to independent) between each risk. The model assumes a 20% probability of default for each risk and the results, based upon 250,000 simulations, are presented in the graph below. What it does show is that even at a high level of correlation (e.g. 90%) the impact is considerable.

click to enlarge5 risk pool with correlations from 100% to 0%

The graph below shows the default probabilities as a percentage of the totally dependent levels (i.e 20% for each of the 5 risks). In effect it shows the level of diversification that will result from varying correlation from 0% to 100%. It underlines how misestimating correlation can confound model results.

click to enlargeDefault probabilities & correlations